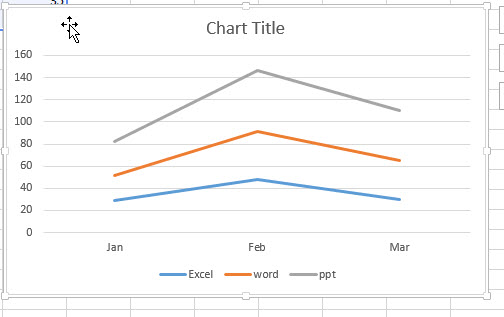
This post will guide you how to add drop lines to a line chart or graph in Excel. You can add drop lines to a line chart to connect the data point on the axis. It can make it easier to determine the X value where each data point occurs.
Adding Drop Lines in Excel Line Chart
To add drop lines to an Existing Excel Line chart, just do the following steps:
#1 Select the existing Line Chart.
#2 go to the Design Tab, click Add Chart Element button under the Chart Layouts group.
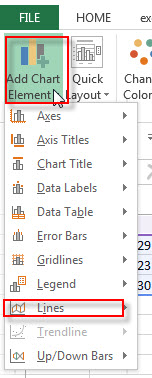
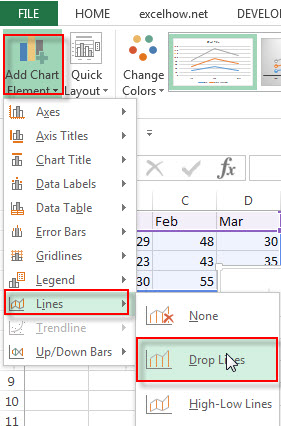
#3 Select Lines, then click Drop Lines.
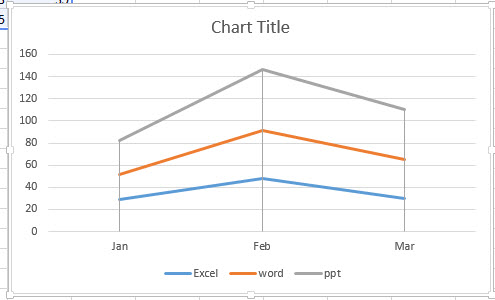
4# let’s see the last result.
Leave a Reply
You must be logged in to post a comment.