This post will guide you how to format excel chart axis to percentage in Excel. How do I change the Axis of Chart to percentage in Excel 2013/2016/2019/365. How to add percentage sing to number on vertical axis bar in your current Chart in Excel.
When you create a chart in your worksheet based on your data source, the number in both Axis are in general category. If you want to change the number category for Axis to percentage. You can do the following steps to achieve the result of format number category of chart Axis as Percentage.
Table of Contents
1. Change Axis to Percentage in Excel
Assuming that you have a list of data in range A1:B4, and you have created a line chart based on those data in your current worksheet. Like below:
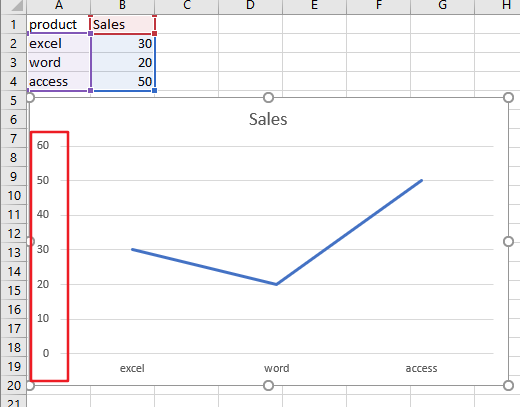
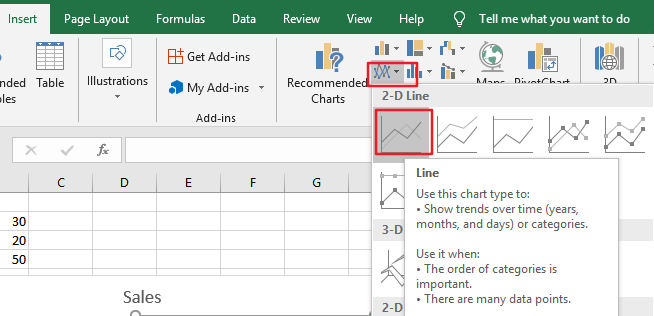
Step1: select range A1:B4, and then go to Insert tab, click Insert Line or Area Chart command under Charts group to create a line chart.
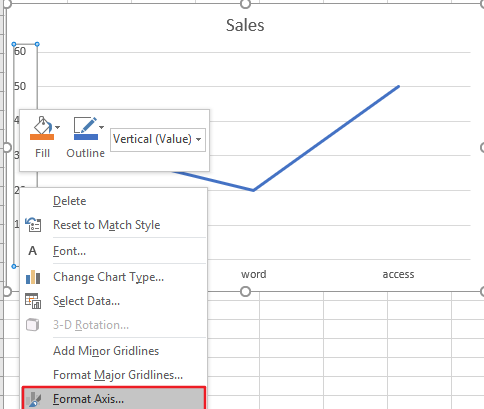
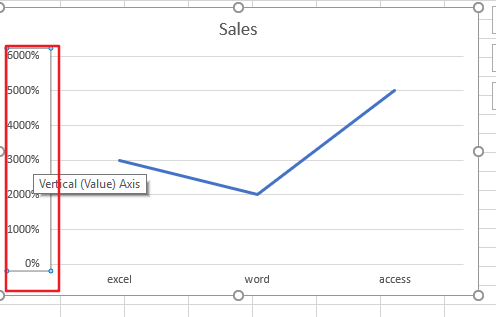
Step2: right click the Axis label where you want to change label number as percentage, such as: vertical Axis label. And the Format Axis pane will appear in the right of window.
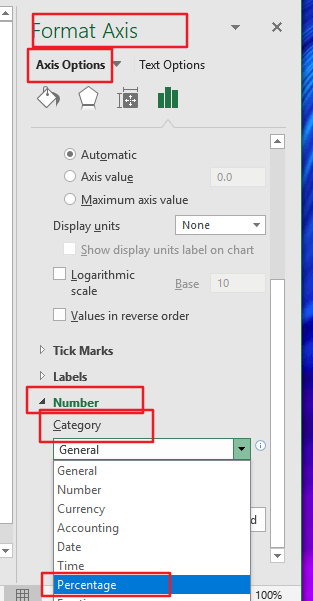
Step3: select Axis Options in the Format Axis pane, expand the number section on the Axis Options, and click the Category list and select percentage value from the dropdown list box. Then change the Decimal places as number 0. Close the Format Axis pane.
Step4: you would see that the number category in the selected Axis label has been changed as percentage format. Like below:
2. Video: How to Change Axis to Percentage in Excel
This video will demonstrate step-by-step instructions on how to change the axis to percentage in Excel for clear data representation.
Conclusion
Changing the axis to percentage in Excel can be a useful technique to represent data accurately and effectively. By converting the axis to percentages, you can display the relative proportions of different categories or variables, allowing you to analyze trends and patterns more easily.
Leave a Reply
You must be logged in to post a comment.