This post will guide you how to swap the X axis and the Y Axis in an existing Scatter Chart in your current worksheet in Excel. How do I quickly switch or flip X and Y Axis in an Excel Scatter chart.
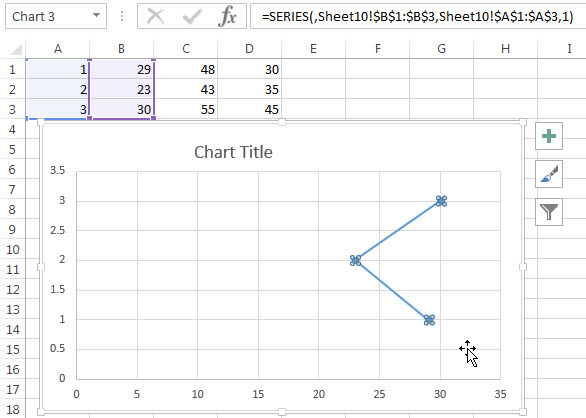
Assuming that you have a set of data that has been created a scatter chart as the following chart.
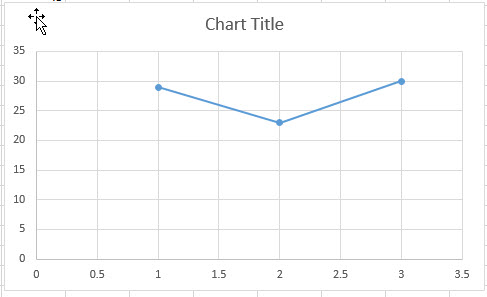
And you want to switch the X axis and Y axis in this Excel graph. Just do the following steps:
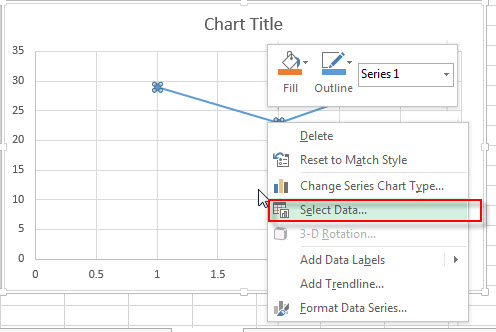
#1 Right click on the scatter chart and then click Select Data from the pop-up menu list.
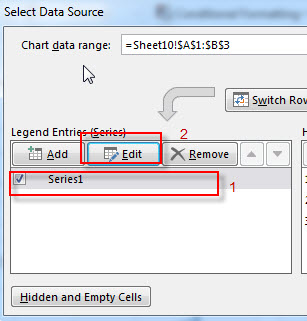
#2 the Select Data Source window will appear.
#3 select the first Series1 in the Legend Entries section, then click Edit button.
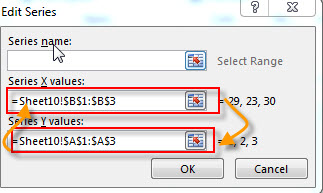
#4 the Edit Series window appear. Then you can copy the Series X values to the Series Y values and vise versa. Click OK button.
#5 if you have two or more Series, just repeat the step 3 and step 4.
#6 let’s see the last result.
Leave a Reply
You must be logged in to post a comment.