This post will guide you how to create bubble chart in Excel. How do I present your data in a bubble chart in Excel.
A bubble chart is a variation of a scatter chart in which the data points are replaced with bubbles, and an additional dimension of the data is represented in the size of the bubbles.
Create Bubble Chart
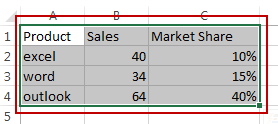
Assuming that you have a list of data in range A1:C4, and you want to create a bubble chart based on those data in your worksheet. And you can do the following steps:
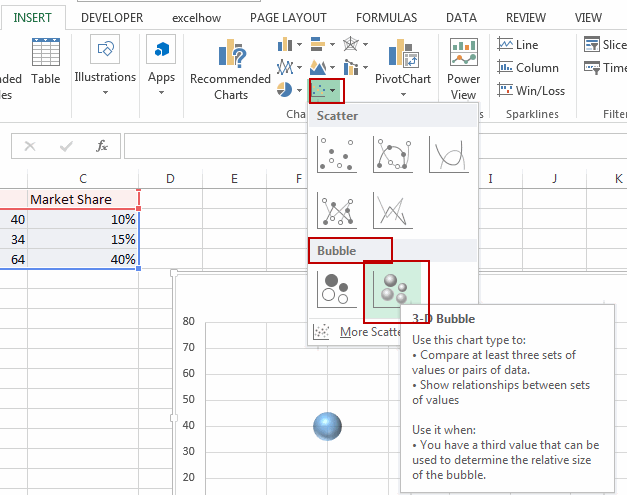
#1 select the data that you want to plot in the bubble chart.
#2 go to INSERT tab, click Insert Scatter or Bubble Chart command under Charts group, and click 3-D Bubble from the Bubble section.
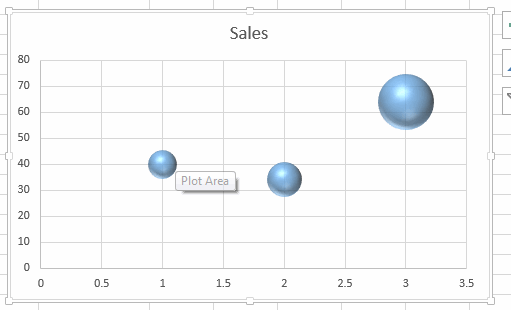
#3 one bubble chart will be created in your worksheet.
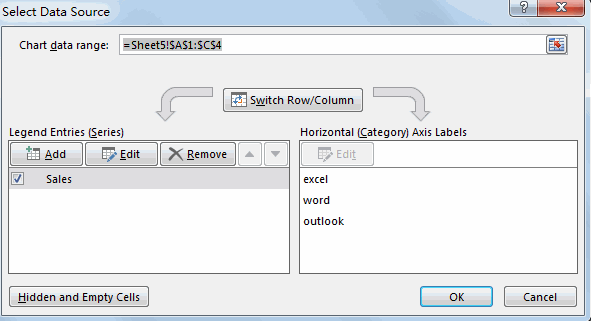
#4 right click on the bubble chart, and click Select Data from the drop down list, and the Select Data Source dialog will open.
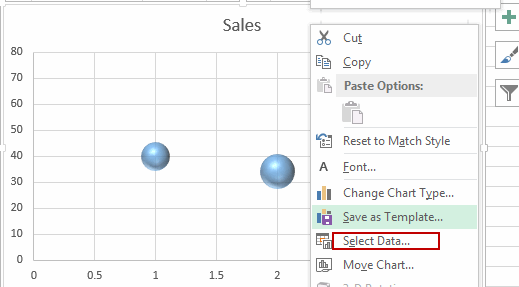
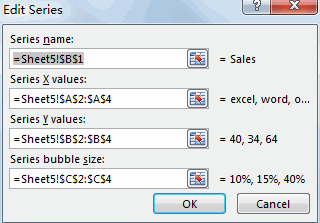
#5 click Edit button under Legend Entries section, and the Edit Series dialog will open. You can set series name, Series X values, Series Y values, and Series bubble size as you need.
Leave a Reply
You must be logged in to post a comment.