This post will guide you how to create a stock chart to present your stock’s data in an easy to read manner in your current worksheet in Excel. How do I create a High-Low-Close Stock market chart based on your stock data in Excel 2013/2016.
1. Create High-Low-Close Stock Chart
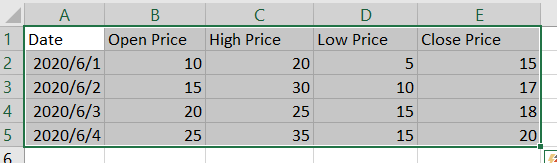
If you want to create a high-low-close chart, your data need to contain open price, high price, low price, close price and date. It can be used to show the daily high price, low price, and closing prices for a stock over a given period of time. Data can be similar with the below shown:
Then you can create the High-Low-Close Stock chart with the following steps:
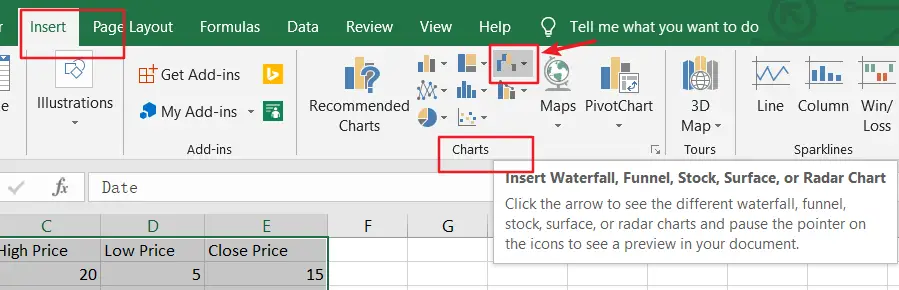
Step1: select your source data.
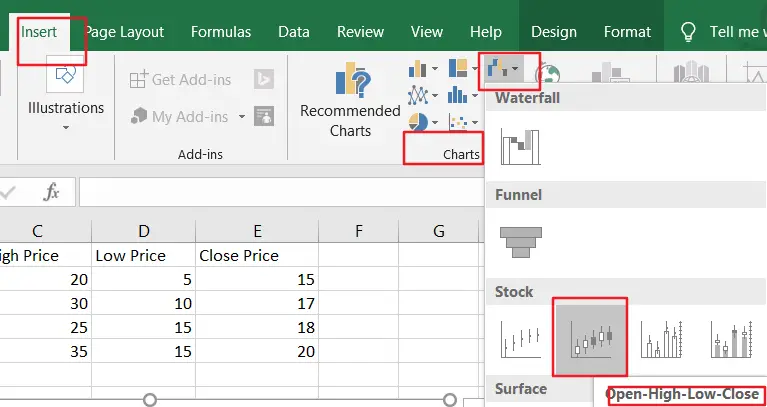
Step2: go to Insert tab in the Excel Ribbon, and click Other charts or Insert Waterfall, Funnel, Stock, Surface, or Radar Chart command under Charts group. And select Open-High-Low-Close in the Stock section from the dropdown list box.
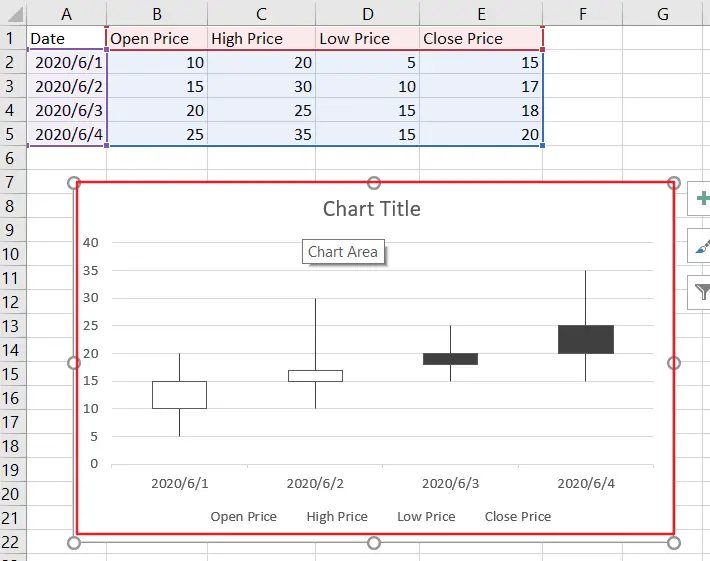
Step3: Stock chart will be created as below:
2. Video: Create High-Low-Close Stock Chart
In this video, we’re diving into the fascinating world of creating stock charts, specifically Open-High-Low-Close (OHLC) charts, right in Excel.
Leave a Reply
You must be logged in to post a comment.