This post will introduce how to combine two pivot tables into one pivot chart in Microsoft Excel. Combining pivot tables into one chart is a very useful operation for analyzing large amounts of data and comparing different sets of information.
This process allows you to take data from two separate pivot tables and display it in a single chart, making it easier to identify trends, patterns, and relationships between the data.
Table of Contents
1. Combine Two Pivot Tables into One Pivot Chart
If you want to combine two pivot table into one pivot chart, and you need to combine two pivot tables into one pivot table firstly, then create one pivot chart based on the latest pivot table.
Assuming that you have two tables and you have created two pivot tables based on those tables.
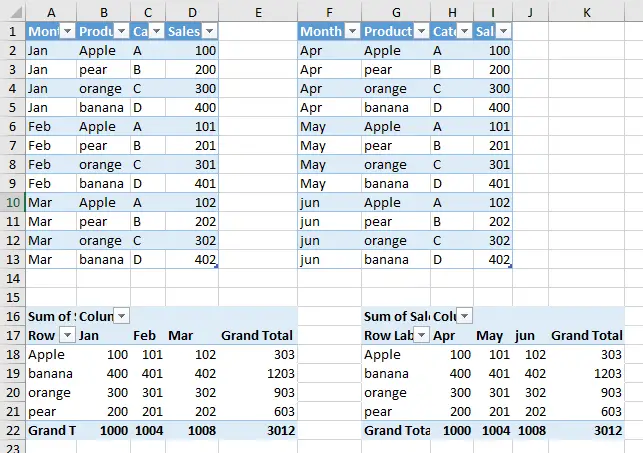
You can combine two pivot tables into one chart by following these steps:
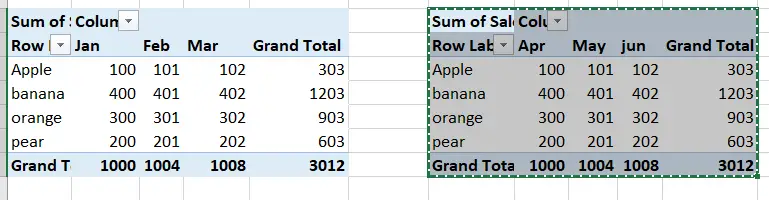
Step 1: select and copy the data from the second pivot table.
Step 2: Select the first pivot table and go to the “Home” tab.
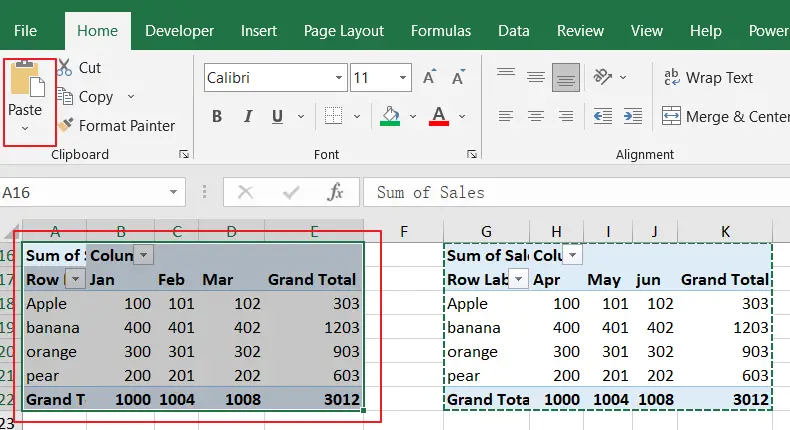
Step 3: In the “Clipboard” group, click the “Paste” drop-down and select “Paste Special.”
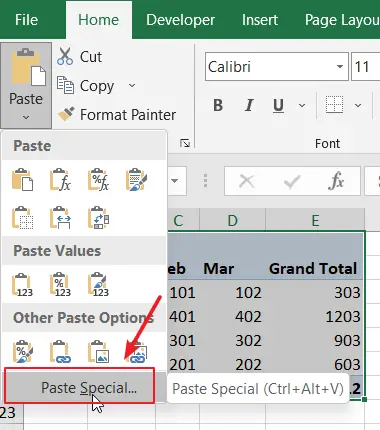
Step 4: In the “Paste Special” dialog box, select “Values” and “Add.”
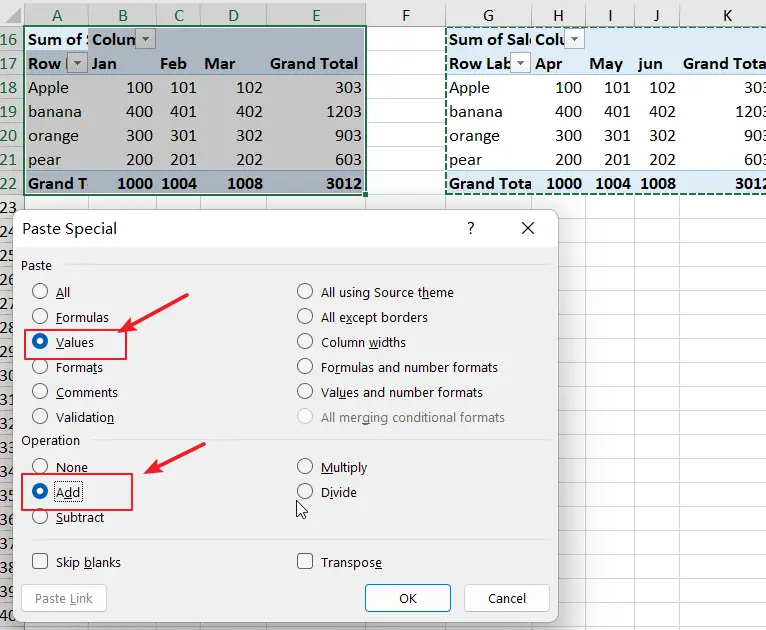
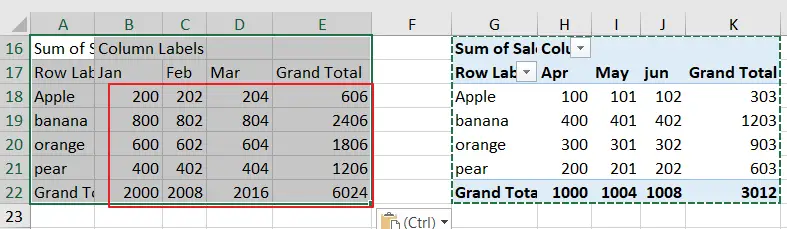
Step 5: Click OK to combine the data from the second pivot table with the first pivot table.
Step 6: Refresh the first pivot table to include the newly added data
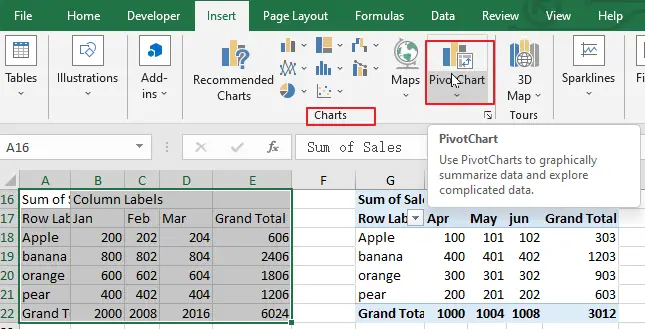
Step7: After creating the pivot table, go to the “Insert” tab and click PivotChart button under Chart group in Excel Ribbon.
Step8: In the “Create PivotChart” dialog box, select the range of data you want to include and choose where you want to place the pivot graph (e.g., a new worksheet or an existing worksheet).
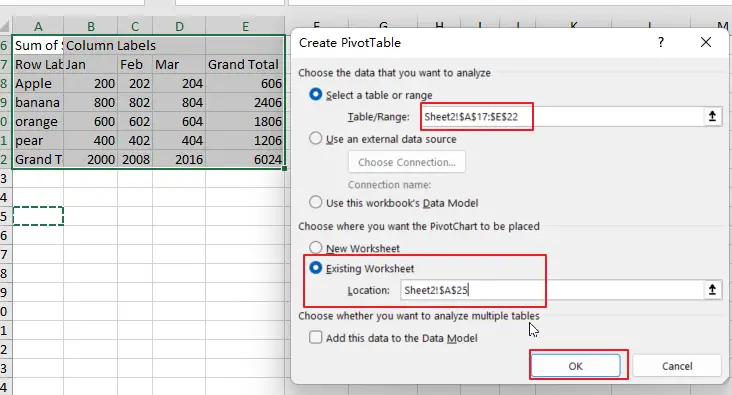
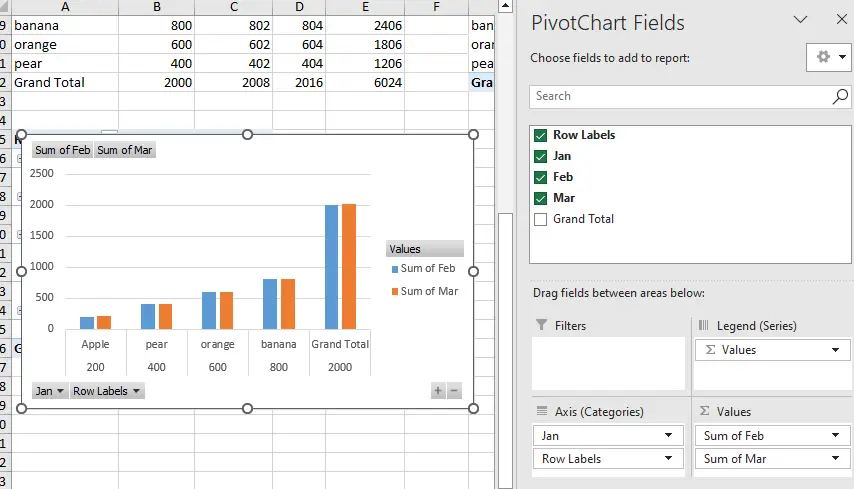
Step 9: The pivot graph will be created based on the data in the pivot table.
2. Conclusion
Whether you are working with financial data, sales data, or any other type of data, combining pivot tables into one chart can help you get the most out of your data and make data-driven decisions.
Leave a Reply
You must be logged in to post a comment.