This post will guide you how to create one Column Chart in your worksheet based on the specified data in Excel. And the Column chart is a primary Excel Chart type and it is a graph that shows vertical bars with the axis values for the bars displayed on the graph in a worksheet.
Create Column Chart
If you want to create a column chart in your current worksheet, just do following steps:
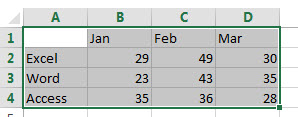
1# Select the data range, such as: A1:D4
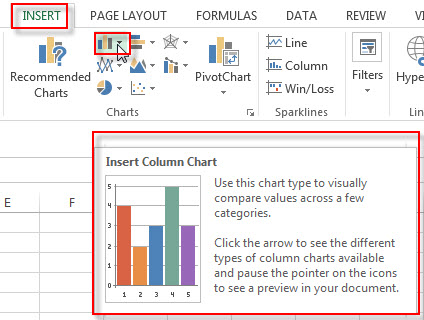
2# go to Insert Tab, Click Insert Column Chart button under Charts group.
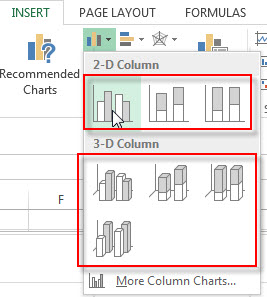
3# click any one Clustered Column from the drop down list
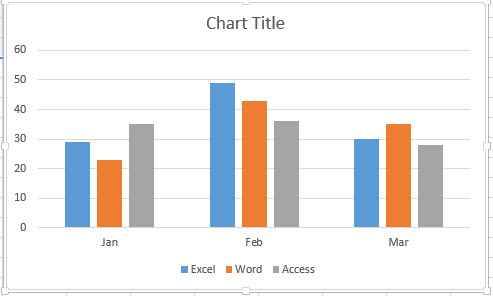
4# you will see that one Excel Column Chart has been generated as below:
Leave a Reply
You must be logged in to post a comment.