This post will guide you how to add a single data point in an existing line char in excel. How do I add a single point to a graph that already has a line chart in Excel 2013/2016/2019.
Assuming that you have a line chart in excel, and the product cost is on the y-axis, and the product is in the x-axis. And if you want to add a single data point appear on that line chart based on a number that you typed into a value into one cell in another column. You can refer to the below steps:
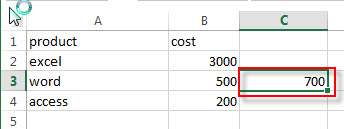
1# type one data point value in one cell in a new column, such as Cell C2.
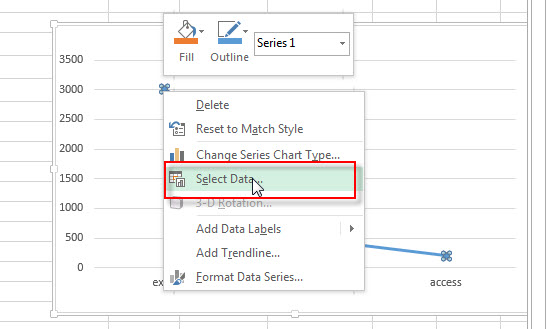
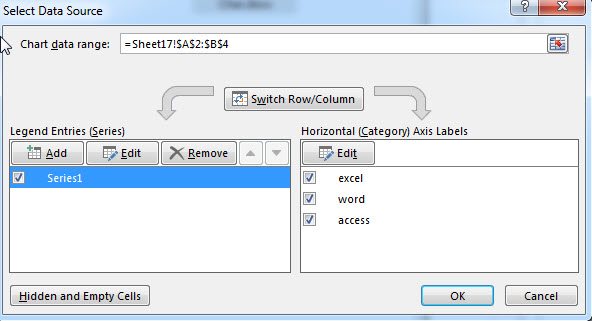
2# Right click on the existing line chart, and click Select Data…from the drop-down list. And the “Select Data Source” window will appear.
3# Click “Add” button in the Legend Entries section.
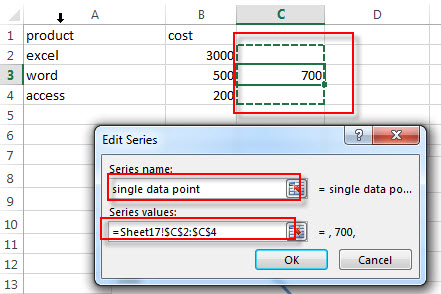
4# enter one Series name in the Series name text box, such as: single data point, then choose the whole column including that single data point value (Cell C2). Click OK button.
5# you will see that the specified data point has been added on the existing line chart.

Video: Adding Data Points to an Existing Line Chart
This video tutorial on elevating your line charts in Excel, we’ll explore how to add data points to an existing line chart.
Leave a Reply
You must be logged in to post a comment.