This post will guide you how to show or hide chart Axis in your current worksheet in Excel 2013/2016. How do I show or hide Axes or 3-D chart Axes, Horizontal Axis, Vertical Axis or secondary Vertical Axis in your chart in Excel.
Normally, Once you create a newly chart based on your data in your worksheet, the vertical Axis and the horizontal Axis are displayed automatically in Excel. But for some cased, it is not necessary to display all or any of the axes for your specified chart. You can try to hide chart axis in Excel.
Table of Contents
What is Axis in Excel
Each axis is a line on a chart that together define its structure and which the data plotted on the graph is measured against. The Y axis is the vertical access, in other words the one that goes up and down. The X access is horizontal and so it goes across a chart. The Y axis is sometimes known as the value axis. Having an axis is common on scatter diagrams or X-Y Charts, bar charts and others. You do not have one on a pie chart. Most of Chart types have two axes: vertical axis and horizontal axis.
In addition to vertical and horizontal axes, there is another axis called 3-D chart Axes, and also called the secondary vertical axis or depth axis, and it will plot data along the third dimension of a chart.
The secondary vertical axis shows the values for the associated data series, and it works well in a chart that show a combination of column and line charts.
Hide and Display Chart Axes
If you want to hide one or more axes in your excel chart in your current worksheet, and just do the following steps:
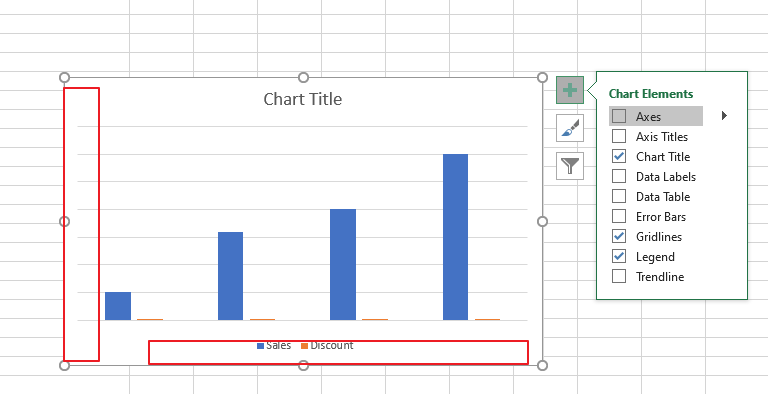
Step1: select a blank area of your chart, then the Chart Tools will be displayed on the right side of the chart.
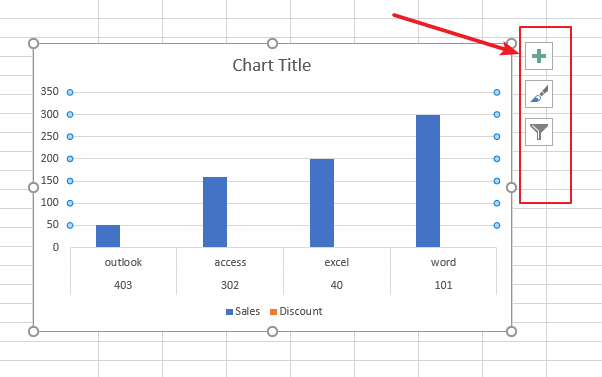
Step2: select Chart Elements button on the Chart Tools, and click the plus sign(+), and the Chart Elements menu will appear.
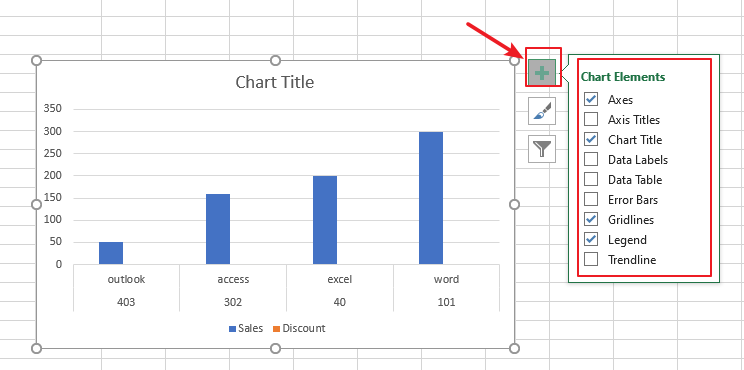
Step3: if you want to hide all chart axes, just uncheck the Axes check box.
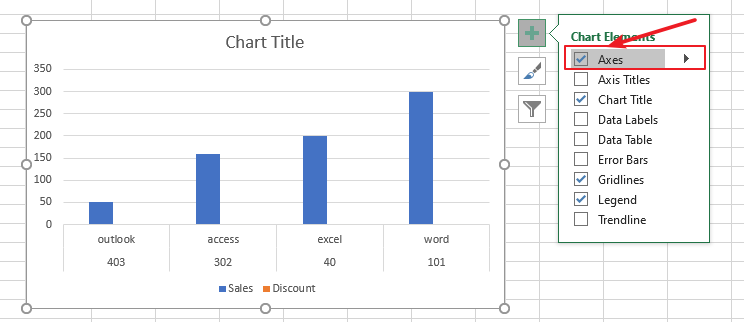
Step4: if you want to hide primary or secondary axis or more axes, and you need to click the right arrow to display a list of axes that can be hidden or displayed on the chart as you need. You just need to uncheck the check box for the axes that you want to hide.
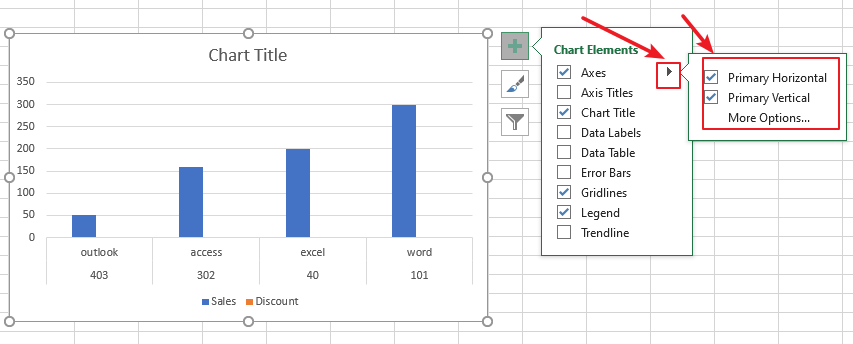
Step5: To show one or more chart axes or one specified axis, and you just need to follow the above steps to check the check box for the axes that you want to display.