This post will guide you how to add arrows to the existing Colum chart in Excel. How do I make arrow chart in Excel.
Table of Contents
1. Add Arrows to Column Chart
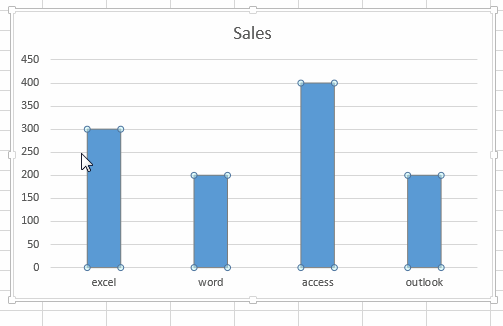
When you create a column chart in your worksheet, the column bars are shown in the column chart, and if you want to change the current column bars as arrow bars, how to do ti. You can do it by the following steps:
#1 create a column chart based on your data.

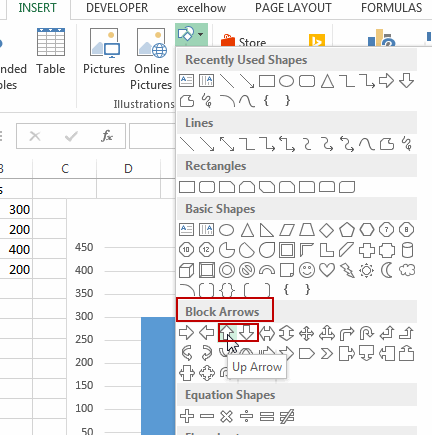
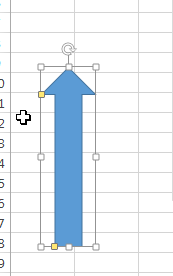
#2 go to INSERT tab, click Shapes command under Illustrations group. And select Up Arrow or Down Arrow from the Block Arrows section in the drop down menu list.
#3 drag the mouse to draw the arrows in your worksheet.
#4 click arrows to select it, and press Ctrl + C keys to copy it. And then click data series in the column chart, all data series should be selected.
#5 press Ctrl +V to paste the arrow to the chart to replace all column bars as Arrows.
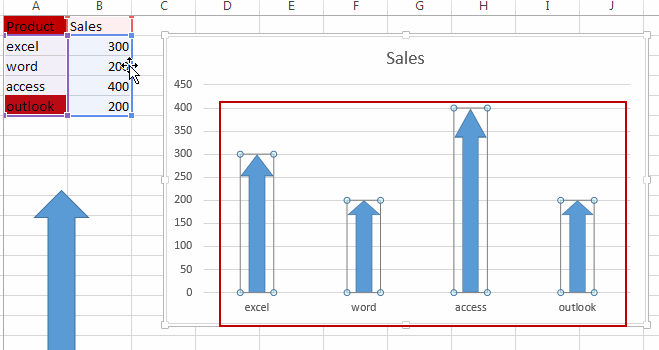
You should notice that all column bars have been replaced as Arrows in your column chart. Then you delete that arrow you created in step3 as you need.
2. Video: Add Arrows to Column Chart
This Excel video Tutorial, we’re going to add arrows to column charts to make your data visualization more impactful.
Leave a Reply
You must be logged in to post a comment.