The Bell curve chart is also called as normal probability distributions in Statistics and it will be used to show a plot of normal distribution of a given data set. This post will guide you how to create a chart of a bell curve in Microsoft Excel. And How to save the generated bell curve chart as normal chart template in Excel.
Table of Contents
1. Create Bell Curve Chart
You can refer to the below examples to create a sample bell curve, just do the following steps:
#1 enter the following column headings in a new worksheet (Data, Mean, Standard deviation, Distribution)
The mean is the average value of all the data points in range A2:A10. And the Standard Deviation indicates how much deviates from the mean of the data set.
#2 enter the data in the range A2:A10
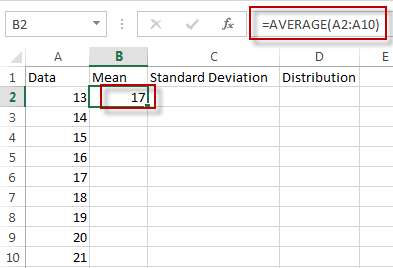
#3 enter the formula =AVERAGE(A2:A10) in the formula box of cell B2 to generate the Mean value.
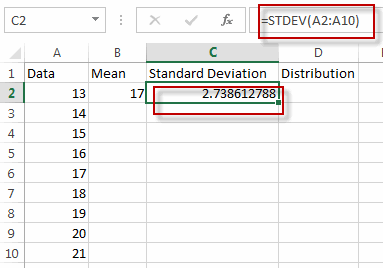
#4 enter the formula =STDEV(A2:A10) in the formula box of cell C2 to generate the standard deviation.
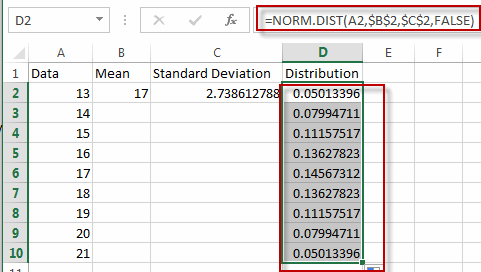
#5 enter the formula =NORM.DIST(A2,$B$2,$C$2,FALSE) in the formula box of cell D2 to generate normal probability distribution. Then drag Auto Fill Handler over other cells from D2 to D10.

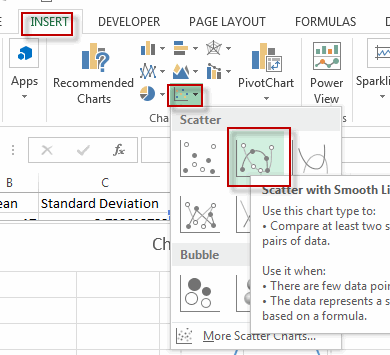
#6 select range A2:A10 and D2:D10, then go to INSERT tab, click Scatter with Smooth Lines under charts group.
#7 you will see a bell curve is created.
create bell curve chart5 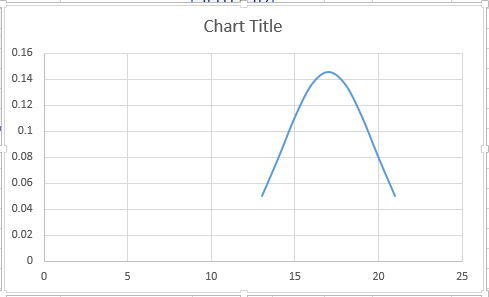
2. Save Bell Curve Chart as Chart Template
If you want to save the generated bell curve chart as chart template, just refer to the below steps:
#1 right click on the bell curve chart, select Save as Template… from the pop up menu list.
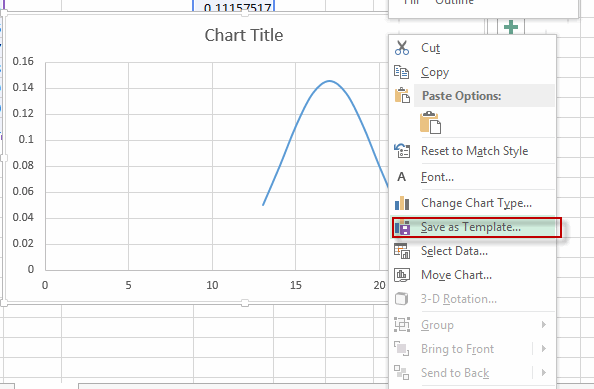
#2 enter the file name, and click Save button.

3. Video: Create Bell Curve Chart
This Excel video tutorial, where we’ll master the art of visualizing data through the creation of a bell curve chart, an essential statistical tool for depicting the normal distribution of any given dataset.
4. Related Functions
- Excel AVERAGE function
The Excel AVERAGE function returns the average of the numbers that you provided.The syntax of the AVERAGE function is as below:=AVERAGE (number1,[number2],…)…. - Excel STDEV Function
The Excel STDEV function returns the standard deviation of a population based on a sample of numbers. This function has been replaced by the STDEV.S function in Excel 2010.The syntax of the STDEV function is as below:= STDEV (number1,[number2],…)…
Leave a Reply
You must be logged in to post a comment.