This post will explore what the STOCKHISTORY function does, how it works in Excel 365, and walk through a practical example to help you understand its real-world applications.
Table of Contents
- What is the STOCKHISTORY Function?
- Syntax of the STOCKHISTORY Function
- Example 1: Retrieving Daily Closing Prices for a Single Stock
- Example 2: Retrieving Weekly High and Low Prices
- Example 3: Calculating Monthly Average Closing Prices
- Example 4: Retrieving Trading Volume Data
- Example 5: Comparing Yearly Performance of Multiple Stocks
- Example 6: Retrieving Monthly Opening and Closing Prices
- Example 7: Identifying the Best and Worst Performing Months
- Example 8: Creating a Stock Dashboard
- Video: Using STOCKHISTORY Function
What is the STOCKHISTORY Function?
The STOCKHISTORY function is a relatively new addition to Excel, designed to pull historical stock market data directly into your spreadsheets. It allows you to retrieve information such as opening prices, closing prices, high and low prices, and trading volumes for specific stocks over a defined period.
This function is incredibly useful for investors, financial analysts, or anyone who needs to track and analyze stock performance without leaving Excel. It eliminates the need for manual data entry or importing data from external sources, saving you time and ensuring accuracy.
Syntax of the STOCKHISTORY Function
Let’s break down the syntax of the STOCKHISTORY function. It has several arguments, but only the first two are required:
- Stock: The ticker symbol of the stock you want to analyze (e.g., ‘AAPL’ for Apple).
- Start Date: The start date for the historical data.
- End Date (optional): The end date for the historical data. If omitted, Excel defaults to the current date.
- Interval (optional): The frequency of the data, such as daily, weekly, or monthly.
- Headers (optional): Whether to include headers in the output.
- Properties (optional): Specific data points to retrieve, such as closing price or volume.
The syntax looks like this:
=STOCKHISTORY(stock, start_date, [end_date], [interval], [headers], [properties])Now, let’s see how this works in practice with a brand-new example.
Imagine you’re an investor analyzing the performance of three tech stocks—Apple (AAPL), Microsoft (MSFT), and Google (GOOGL)—over the past year. You want to retrieve their daily closing prices and calculate their average monthly performance. Here’s how you can do it using the STOCKHISTORY function.
Example 1: Retrieving Daily Closing Prices for a Single Stock
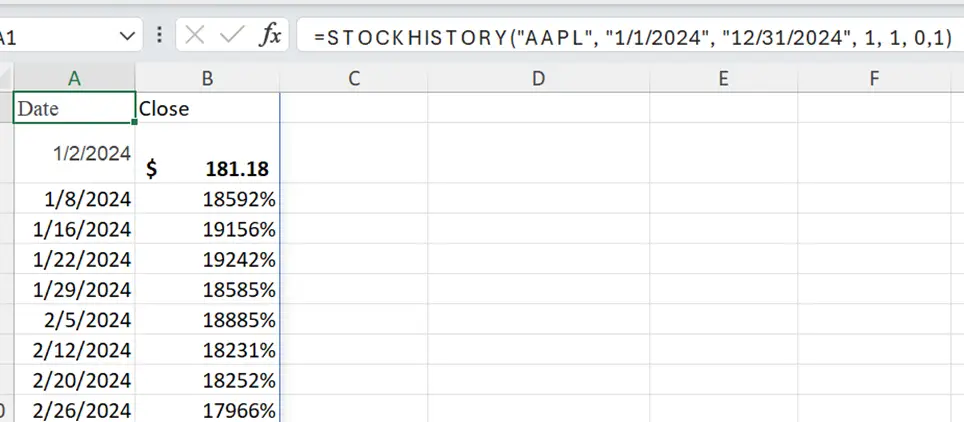
Let’s start with the most basic use case: retrieving daily closing prices for a single stock. Suppose you want to analyze the daily closing prices of Apple Inc. (AAPL) over the past year. This is useful for tracking price trends, identifying patterns, or calculating returns.
Use the following formula:
=STOCKHISTORY("AAPL", "1/1/2024", "12/31/2024", 0, 1, 0,1)Let’s break this down:
- ‘AAPL’ is the ticker symbol for Apple.
- ‘1/1/2024‘ and ’12/31/2024‘ define the start and end dates for the data.
- 0 specifies a daily interval.
- 1 includes headers in the output.
- 1 retrieves the closing price.
Here’s what the output looks like:

With this data, you can create line charts to visualize price trends, calculate daily returns, or identify significant price movements. For example, you might notice a sharp increase in Apple’s stock price in June, which could correlate with a product launch or earnings report.
Example 2: Retrieving Weekly High and Low Prices
Next, let’s retrieve the weekly high and low prices for Microsoft (MSFT). This is useful for understanding the volatility of a stock over time. High and low prices can help you identify resistance and support levels, which are key concepts in technical analysis.
To retrieve the date, high, and low prices, use the following formula:
=STOCKHISTORY("MSFT", "1/1/2024", "12/31/2024", 1, 1, 0, 3, 4)Let’s break this down:
- ‘MSFT’ is the ticker symbol for Microsoft.
- ‘1/1/2024’ and ’12/31/2024′ define the start and end dates for the data.
- 1 specifies a weekly interval.
- 1 includes headers in the output.
- 0, 3, 4 specifies that we want to retrieve the date (0), high price (3), and low price (4).
Here’s what the output looks like:
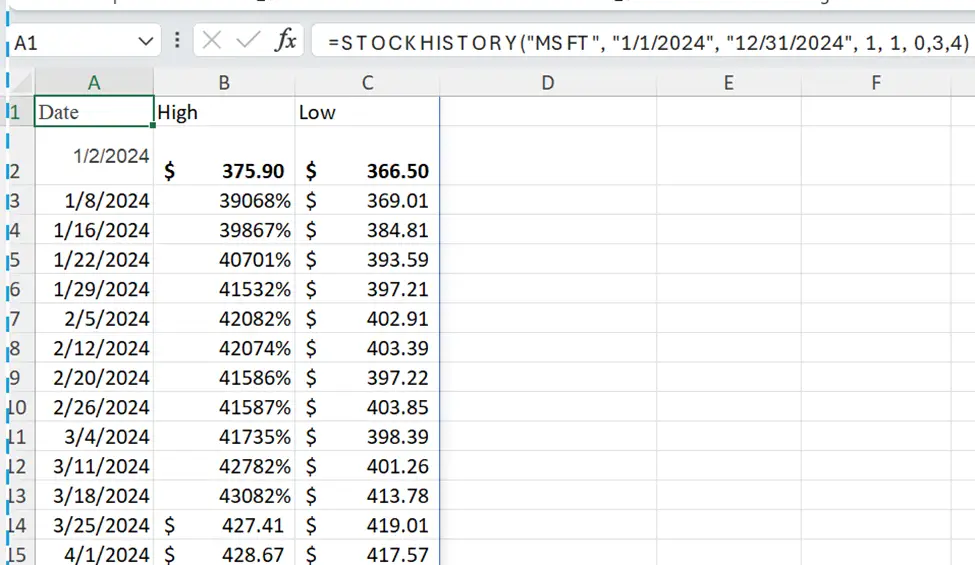
With this data, you can calculate the weekly price range (High – Low) to measure volatility. For instance, if you notice that Microsoft’s price range widened significantly in October, it could indicate increased market activity or news events affecting the stock.
To calculate the weekly price range, use the following formula in a new column:
=B2 - C2Here’s how the updated table looks:
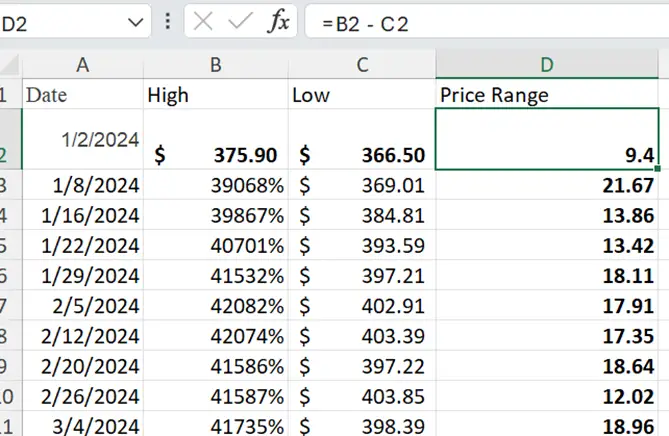
This table now includes the weekly price range, which is a useful metric for analyzing stock volatility. You can use this data to identify periods of high or low volatility and make informed trading decisions.
Example 3: Calculating Monthly Average Closing Prices
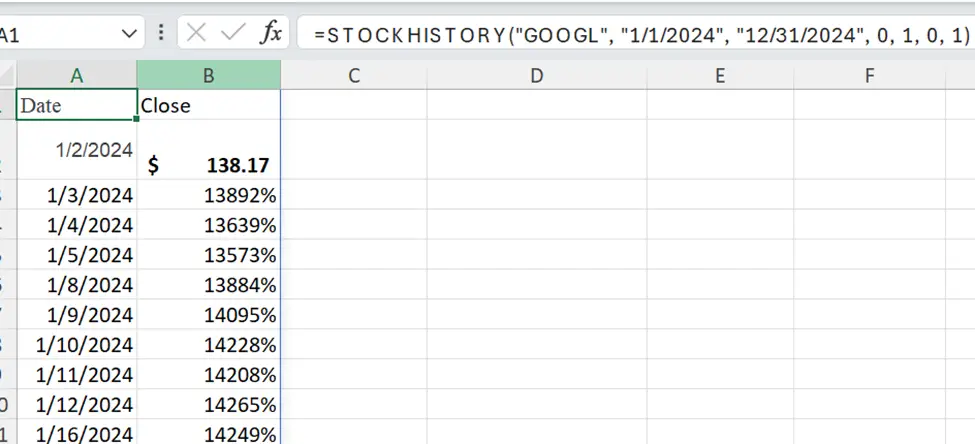
Now, let’s calculate the average monthly closing prices for Google (GOOGL). This is useful for smoothing out daily fluctuations and identifying long-term trends.
First, retrieve the date and daily closing prices using the STOCKHISTORY function. Use the following formula:
=STOCKHISTORY("GOOGL", "1/1/2024", "12/31/2024", 0, 1, 0, 1)Let’s break this down:
- ‘GOOGL’ is the ticker symbol for Google.
- ‘1/1/2024’ and ’12/31/2024′ define the start and end dates for the data.
- 0 specifies a daily interval.
- 1 includes headers in the output.
- 0, 1 specifies that we want to retrieve the date (0) and closing price (1).
Here’s what the output looks like:
Next, we’ll calculate the average monthly closing prices. To do this, we’ll use the AVERAGEIFS function. Here’s the formula for January:
=AVERAGEIFS(B2:B253, A2:A253, ">=1/1/2024", A2:A253, "<=1/31/2024")Let’s break this down:
- B2:B253 is the range containing the daily closing prices.
- A2:A253 is the range containing the dates.
- “>=1/1/2024” and “<=1/31/2024” define the date range for January.
Repeat this formula for each month, adjusting the date range accordingly. Here’s the output:
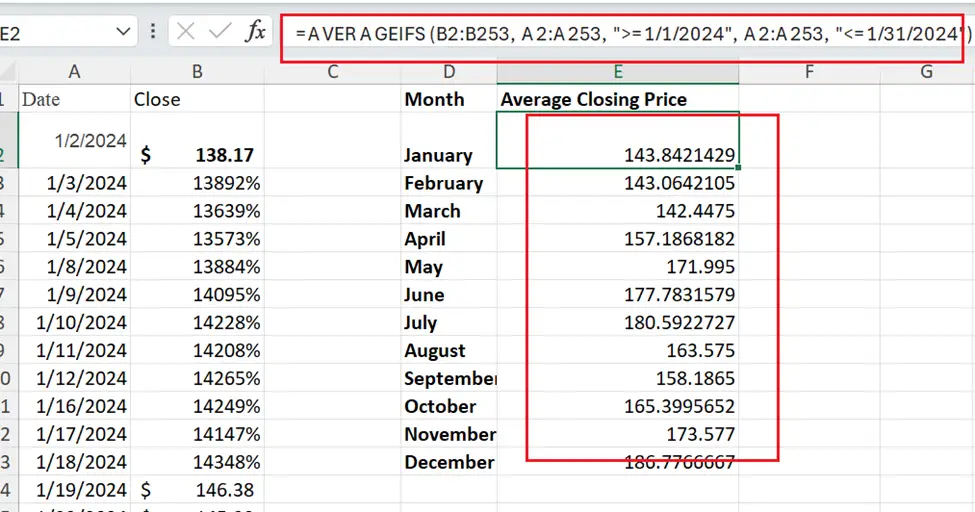
This table shows a steady upward trend in Google’s stock price throughout the year. You can use this data to identify seasonal patterns or compare Google’s performance to other stocks in your portfolio.
Example 4: Retrieving Trading Volume Data
Trading volume is a key indicator of market activity. Let’s analyze the daily trading volume for Tesla (TSLA). High trading volumes often indicate strong investor interest, which can lead to significant price movements.
Use this formula:
=STOCKHISTORY("TSLA", "1/1/2024", "12/31/2024", 0, 1, 0,5)Example 5: Comparing Yearly Performance of Multiple Stocks
Let’s compare the yearly performance of Apple (AAPL), Microsoft (MSFT), and Google (GOOGL). This is useful for evaluating which stocks performed best over the year.
To do this, we’ll retrieve the start and end prices for each stock using the STOCKHISTORY function, then calculate the percentage change for the year. Here’s how you can do it step by step.
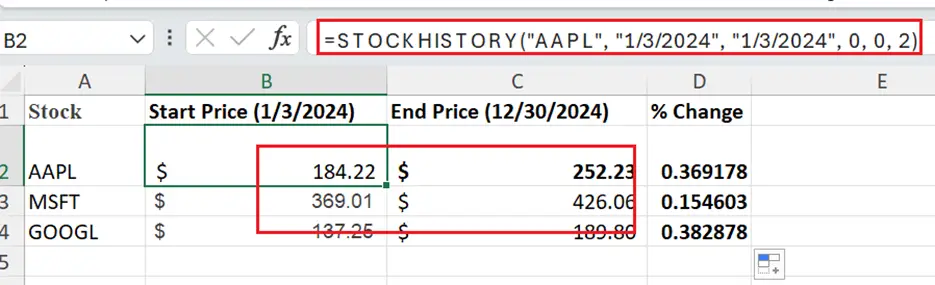
First, retrieve the start price (price on the first trading day of the year) and the end price (price on the last trading day of the year) for each stock.
For Apple (AAPL):
- Start Price:
=STOCKHISTORY("AAPL", "1/1/2024", "1/1/2024", 0, 0, 2) - End Price:
=STOCKHISTORY("AAPL", "12/31/2024", "12/31/2024", 0, 0, 2)
For Microsoft (MSFT):
- Start Price:
=STOCKHISTORY("MSFT", "1/1/2024", "1/1/2024", 0, 0, 2) - End Price:
=STOCKHISTORY("MSFT", "12/31/2024", "12/31/2024", 0, 0, 2)
For Google (GOOGL):
- Start Price:
=STOCKHISTORY("GOOGL", "1/1/2024", "1/1/2024", 0, 0, 2) - End Price:
=STOCKHISTORY("GOOGL", "12/31/2024", "12/31/2024", 0, 0, 2)
Let’s break this down:
- The start date and end date are set to the same day to retrieve the price for that specific day.
- 0 specifies a daily interval.
- 0 excludes headers in the output.
- 2 retrieves the closing price.
Here’s what the output looks like:
Next, calculate the percentage change for each stock using the following formula:
=((End Price - Start Price) / Start Price)Here’s the output:
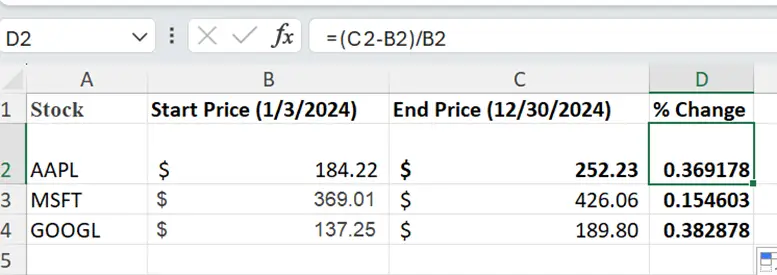
This table shows that Google had the highest annual return at 38%, followed by Apple at 36.9% and Microsoft at 15.5%. You can use this data to evaluate your portfolio’s performance and make informed decisions about rebalancing.
Example 6: Retrieving Monthly Opening and Closing Prices
Let’s retrieve the monthly opening and closing prices for Amazon (AMZN). This is useful for analyzing price gaps and identifying trends at the start and end of each month.
Use this formula:
=STOCKHISTORY("AMZN", "1/1/2024", "12/31/2024", 2, 1, 2,1)Here’s the output:
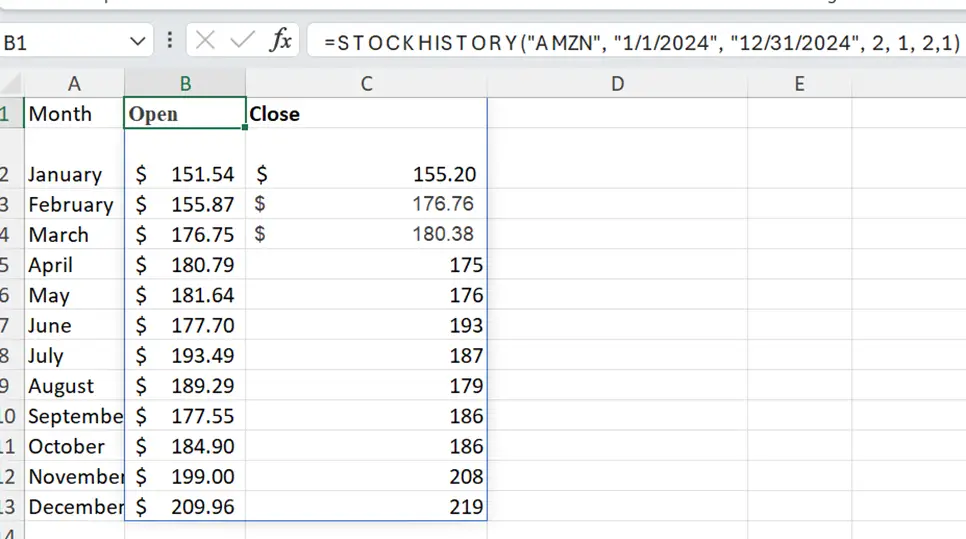
This data shows that Amazon’s stock price consistently increased each month. You can use this information to identify patterns, such as whether Amazon tends to perform better in certain months.
Example 7: Identifying the Best and Worst Performing Months
Let’s identify the best and worst performing months for Netflix (NFLX). This is useful for understanding seasonal trends or evaluating the impact of specific events.
First, retrieve the monthly closing prices using the STOCKHISTORY function:
=STOCKHISTORY("AMZN", "1/1/2024", "12/31/2024", 2, 1, 1)Next, calculate the percentage change for each month using the formula:
=((Current Month Price - Previous Month Price) / Previous Month Price) To automate this, you can use the following formula in Excel (assuming the closing prices are in column B):
=(B3-B2)/B2This table shows that Netflix had its best performance in November with a 17% increase, while April was the worst month with a 9% decline. You can use this data to identify seasonal trends or evaluate the impact of specific events, such as new content releases.
Example 8: Creating a Stock Dashboard
Finally, let’s create a stock dashboard that displays key metrics for multiple stocks. This is useful for monitoring your portfolio at a glance. We’ll retrieve data for Apple (AAPL), Microsoft (MSFT), and Google (GOOGL), and calculate metrics like average price, maximum price, and minimum price for each stock. Here’s how you can do it step by step, with each stock’s data in a separate cell range.
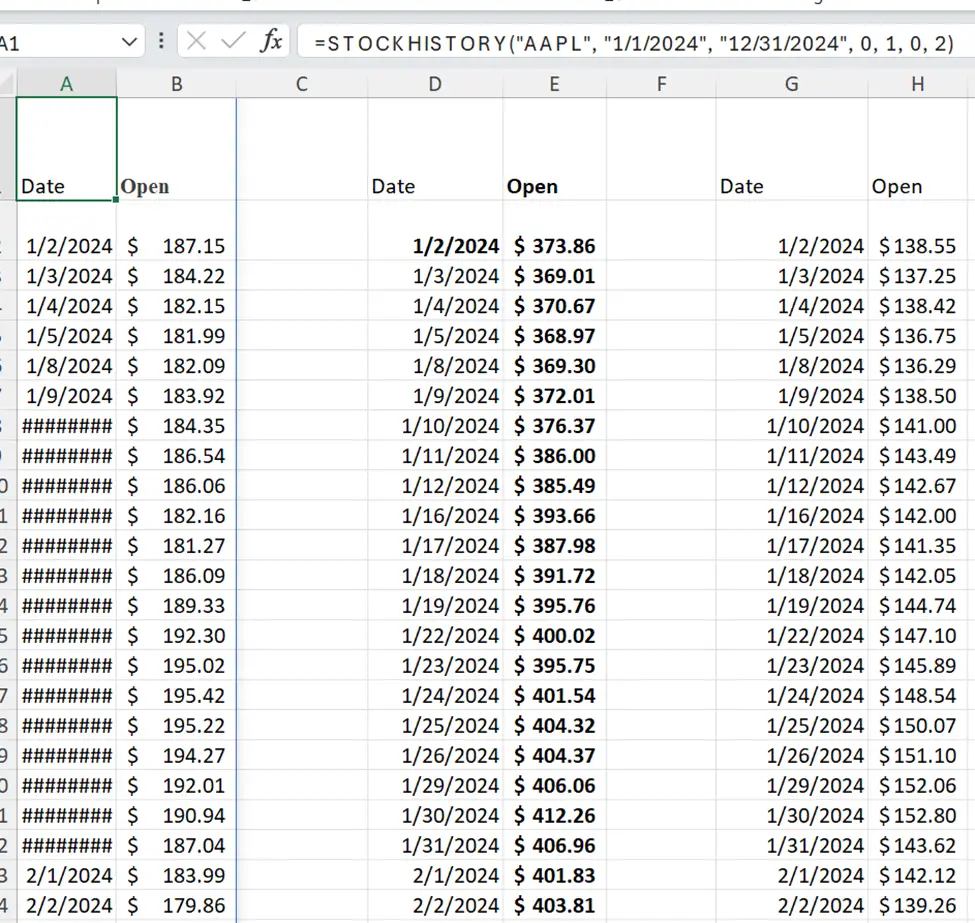
First, retrieve the daily closing prices for each stock using the STOCKHISTORY function. We’ll place each stock’s data in a separate cell range to keep things organized.
For Apple (AAPL):
- Place the formula in cell A1:
=STOCKHISTORY("AAPL", "1/1/2024", "12/31/2024", 0, 1, 0, 2) - This will populate the date and closing price for Apple in columns A and B.
For Microsoft (MSFT):
- Place the formula in cell D1:
=STOCKHISTORY("MSFT", "1/1/2024", "12/31/2024", 0, 1, 0, 2) - This will populate the date and closing price for Microsoft in columns D and E.
For Google (GOOGL):
- Place the formula in cell G1:
=STOCKHISTORY("GOOGL", "1/1/2024", "12/31/2024", 0, 1, 0, 2) - This will populate the date and closing price for Google in columns G and H.
Here’s what the output looks like for each stock:
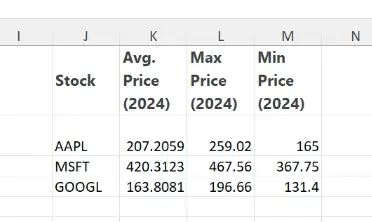
Next, calculate the average price, maximum price, and minimum price for each stock using Excel functions. We’ll place these metrics in a summary table for easy comparison.
For Apple (AAPL):
- Average Price: Place the formula in cell K2:
=AVERAGE(B2:B253) - Maximum Price: Place the formula in cell L2:
=MAX(B2:B253) - Minimum Price: Place the formula in cell M2:
=MIN(B2:B253)
For Microsoft (MSFT):
- Average Price: Place the formula in cell K3:
=AVERAGE(E2:E253) - Maximum Price: Place the formula in cell L3:
=MAX(E2:E253) - Minimum Price: Place the formula in cell M3:
=MIN(E2:E253)
For Google (GOOGL):
- Average Price: Place the formula in cell K4:
=AVERAGE(H2:H253) - Maximum Price: Place the formula in cell L4:
=MAX(H2:H253) - Minimum Price: Place the formula in cell M4:
=MIN(H2:H253)
Here’s what the output looks like:
Then you can Use Excel’s charting tools to create visualizations, such as bar charts or line graphs.
This dashboard provides a quick overview of each stock’s performance. You can expand it to include additional metrics, such as annual returns or trading volumes, depending on your needs
Why Use STOCKHISTORY?
You might be wondering, why not just use external tools or websites for stock data? The beauty of STOCKHISTORY lies in its integration with Excel. It allows you to automate data retrieval, perform calculations, and create dynamic reports—all within a single platform. Plus, it’s a huge time-saver for anyone who regularly analyzes stock market data.
Leave a Reply
You must be logged in to post a comment.