Sometimes we have both positive numbers and negative numbers exist in one table, for example to summarize the profit for one day. And if we create bar chart for this table, some bars are displayed above zero horizontal axis, and others are below this axis, they are displayed in different colors by default. If we want to set one color for positive number, and another color for negative number to make bar chart looks neatly, we can through Fill function in excel to implement this.
Precondition:
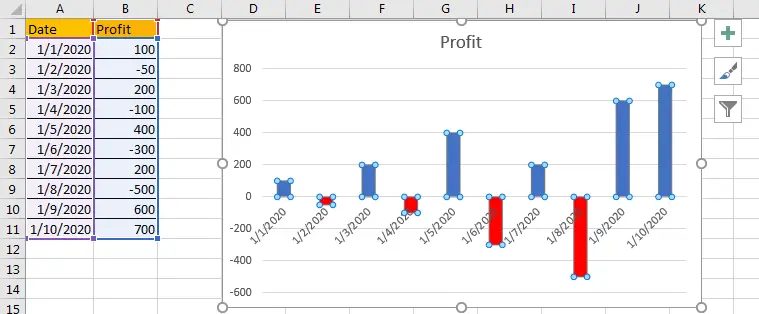
Prepare a table with both positive number and negative number. And create a bar chart for this table.
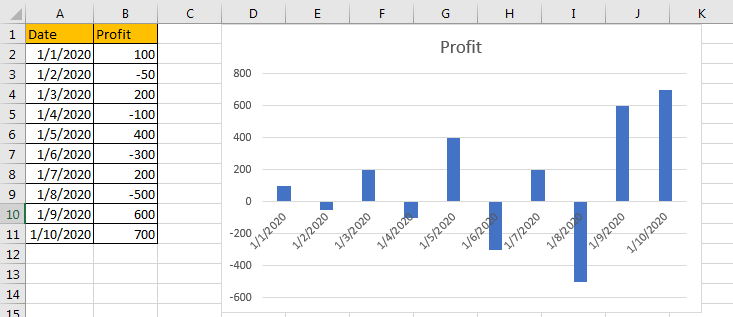
We can see that there is only one color for all bars.
Table of Contents
1. Choose Different Colors to Separate Positive and Negative Number
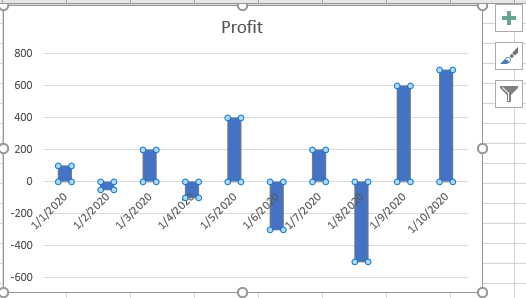
Step1: Select any bar, all other bars are activated at the same time.
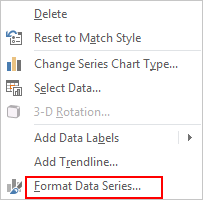
Step2: Then right click to load menu, click ‘Format Data Series’.
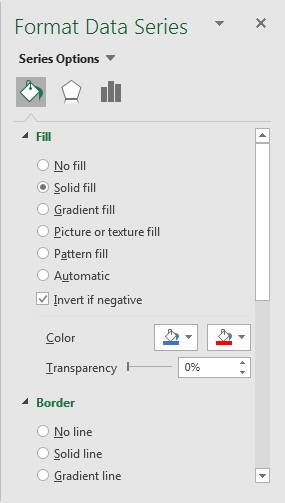
Step3: In Format Data Series pane, click Fill & Line icon, then under Fill, check on Solid fill and Invert if negative, then in Color field, select ‘Blue’ in Fill Color dropdown list and ‘Red’ in Inverted Fill Color.
Step4: After above settings, you can find that all positive numbers are filled with blue, and negative numbers are filled with red properly.
2. Video: Choose Different Colors to Separate Positive and Negative Number
This Excel video tutorial will show you how to set different colors to clearly distinguish between positive and negative numbers, adding a visual dimension to your data representation.