This post will guide you how to group a pivot table by day of week in Excel. How do I group data by week number in pivot table in Excel.
1. Group dates by week in Pivot Table
It should be very useful to group dates by week, days, year, months, etc. And it can help you to analyze your data to get the different views by dates, weeks, months, years, etc.
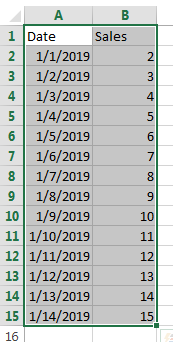
Assuming that you have a list of data in range A1:B15 as shown below:
You need to create a pivot table based on the data in A1:B15, and then group dates by week (7 days) in the pivot table. How to do it. Just do the following steps:
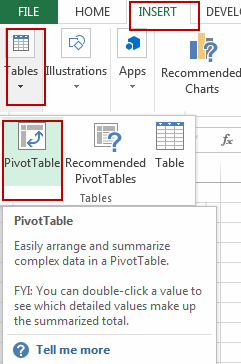
#1 select the range of cells that you want to create pivot table based on.
#2 go to INSERT tab, click the PivotTable command under the Tables group. And the Create PivotTable dialog will appear.
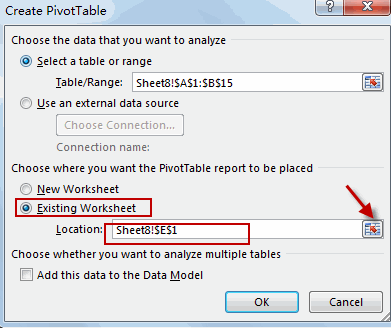
#3 select Existing Worksheet radio button in the Create PivotTable dialog box, and select one cell reference as the destination to place the pivot table. Click Ok button.
#4 you will see that a pivot table is created based on the selected range of cells.
#5 select any cell in the date column in the existing Pivot table. Right click on it, and select Group… from the popup menu list. And the Grouping dialog will open.
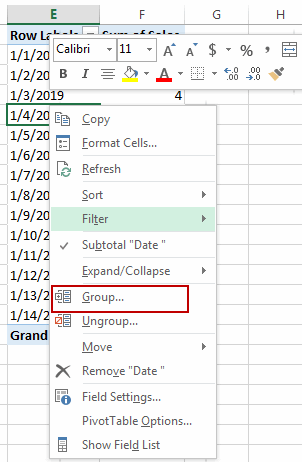
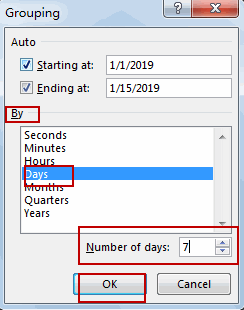
#6 select Days option from the By list box in the Grouping dialog box. And deselect any other selected options. Then enter number 7 in the Number of days text box. Click Ok button.
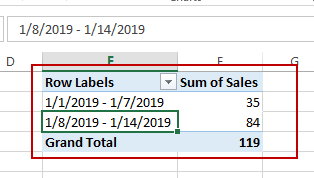
#7 you would notice that your pivot table has been grouped by weeks starting with 1/1/2019 as shown below:
Note: you can use the above steps to group dates by months, quarters or years in the pivot table.
2. Video: Group dates by week in Pivot Table
This Excel video tutorial, we’re going to explore a practical skill: grouping dates by week in a Pivot Table.
Leave a Reply
You must be logged in to post a comment.