We often insert some charts in worksheet to illustrate tables. And in most times, we need to export these charts as JPG or PDF format for some purpose for example insert these charts as pictures into a PowerPoint file or a report. Different with pictures, we cannot save chart as PDF format by ‘Save a picture as’ directly, so we need to find another way to save it. If you have this request, don’t hesitate to read below article. This article will introduce the way to export or save a chart as PDF format conveniently.
Precondition:
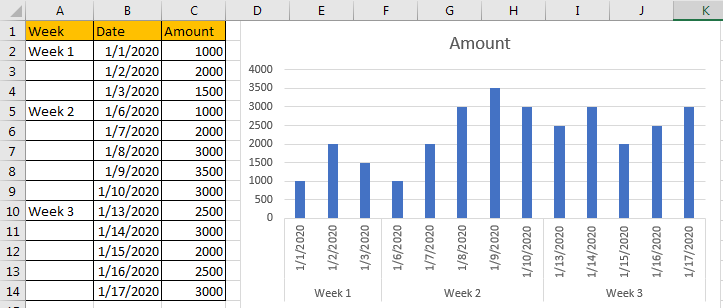
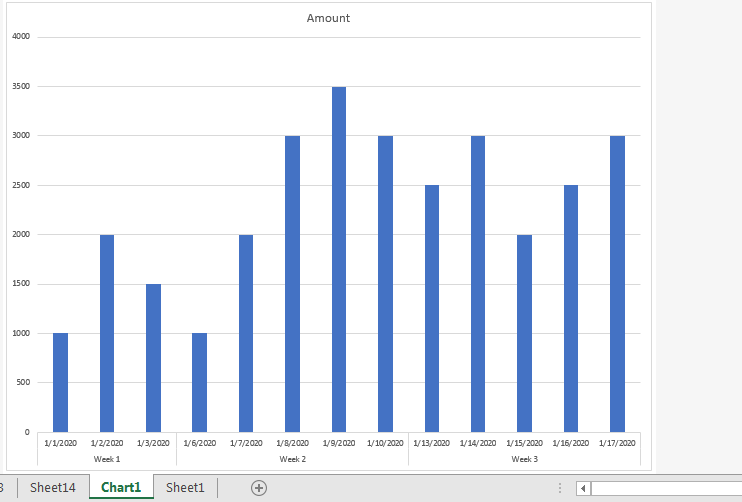
Create a table and insert a clustered column chart for it.

Method: Export Chart as PDF
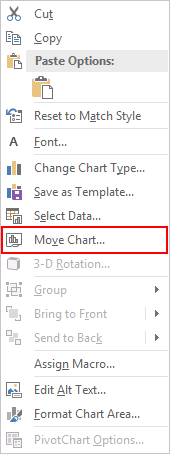
Step 1: Right click in the blanks in the chart, select Move Chart in the menu.

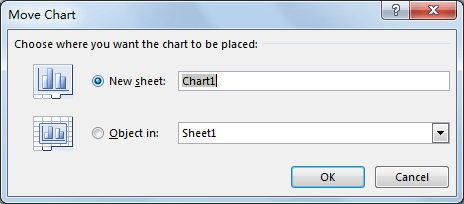
Step 2: After above step, Move Chart dialog pops up. The default option is Object in: Sheet1. We check on New sheet option, and type new sheet name. In this step, we just keep Chart1 as new sheet name. In this step, we want to save this chart into a new sheet. Then click OK.

Step 3: You can find that a new worksheet ‘Chart1’ is created. And unlike other normal worksheets, in this sheet only the chart is displayed.

Step 4: Click File in ribbon.

Then select Sava As.

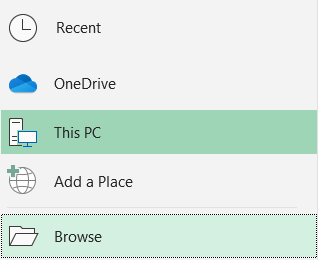
Step 5: You can click This PC or Browse to select save chart location. If you want save it in your computer, select anyone is ok.

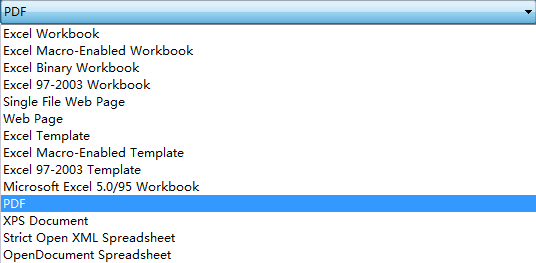
Step 6: After choosing save PDF file location, enter File name as Chart1, in Save as type dropdown list select PDF. Then click Save.


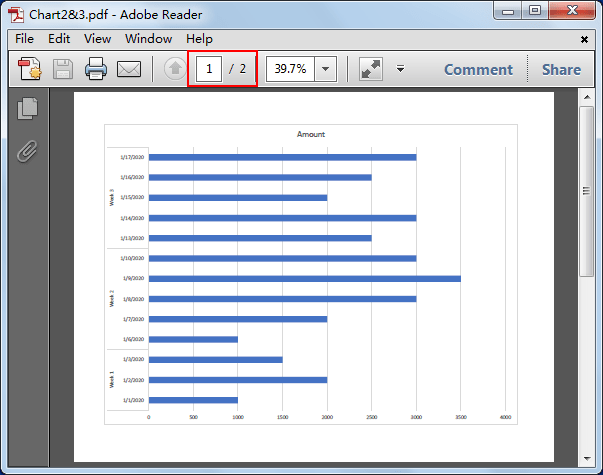
Step 7: Enter your selected location, check whether chart1 is exported properly. I save it on desktop.

Step 8: Double click to open it.

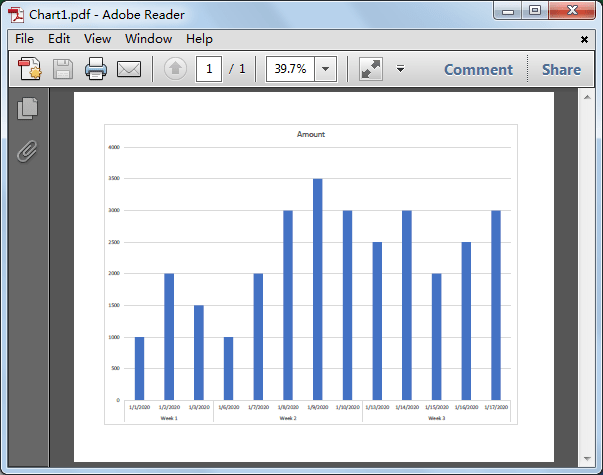
Verify that chart in worksheet is saved as PDF format properly.
Comment:
If there are several charts exist in worksheet, you have to repeat above steps#1-#3 to save them in different sheets. Then hold on Ctrl key on keyboard, click on them one by one manually to select all of them.

Then click File->Save As, refer to above steps to save charts as PDF.

Please noticed that this time the two charts are saved in one PDF file but separated in different pages.

Related Posts
Cap percentage values between 0 and 100
This article will talk about how to cap the percentage values between 0% and 100% in Microsoft Excel Spreadsheet or Google Sheets. If you are a newbie on Excel or google Sheets, you may be able to do this by ...
Calculate Cap Percentages to Specific Value
This article will talk about how to limit the cap percentage of a given amount to a given value in Microsoft Excel Spreadsheet or Google Sheets. If you are a newbie on Excel or google Sheets, you may be able ...
Calculate Win Loss Tie
Suppose you got a task to calculate the win, loss, and tie totals; what would you do? If you are new to Ms Excel and don't have enough experience with it, then you might do this task manually but let ...
Calculate Years Between Dates In Ms Excel
If you are an avid Ms Excel user, then you might have come across a task in which you needed to calculate the years between the dates; you might take it easy and do this task manually, which is also ...
Calculate Number of Hours between Two Times
Calculating the difference between two times might be a valuable statistic for subsequent computations or averages, whether you're producing a time sheet for staff or recording personal exercises. While Excel has a plethora of complex functions, including date and time ...
Calculate Loan Interest in Given Year
When you borrow money, you are supposed to repay it gradually. Lenders, on the other hand, want to be compensated for their services and the risk they incur by lending you money. That is, you will not just repay the ...
Calculate Interest Rate for Loan
The interest rate is the fee charged by a lender to a borrower and is expressed as a percentage of the principal—the lent amount. The interest rate on a loan is often expressed as an annual percentage rate, abbreviated as ...
Calculate Interest for Given Period
Using the IPMT function in Excel, we can compute the interest payment on any loan. This step-by-step tutorial will guide Excel users of all skill levels through the process to calculate interest for given period. Finally, the formula: =IPMT(B3/12,1,B5,-B2) The ...
How To Use Excel GCD Function
This post will guide you how to use Excel GCD function with syntax and examples in Microsoft excel. Description The Excel GCD function Returns the greatest common divisor of two or more integers. So you can use the GCD function ...
Calculate A Ratio From Two Numbers In Excel
In elementary mathematics, a ratio is a connection or comparison between two or more integers. For example, ratios are often expressed as ":" to demonstrate the relationship between two numbers. You would think that manually calculating a ratio from two ...