In daily work, we often need to count the total number for something in different groups, for example count products sales in different seasons. When these products are saved in different groups, do we have a convenient way to do statistic? This article will show you a simple and intuitive way to count data in multiple groups by PivotTable in Excel.
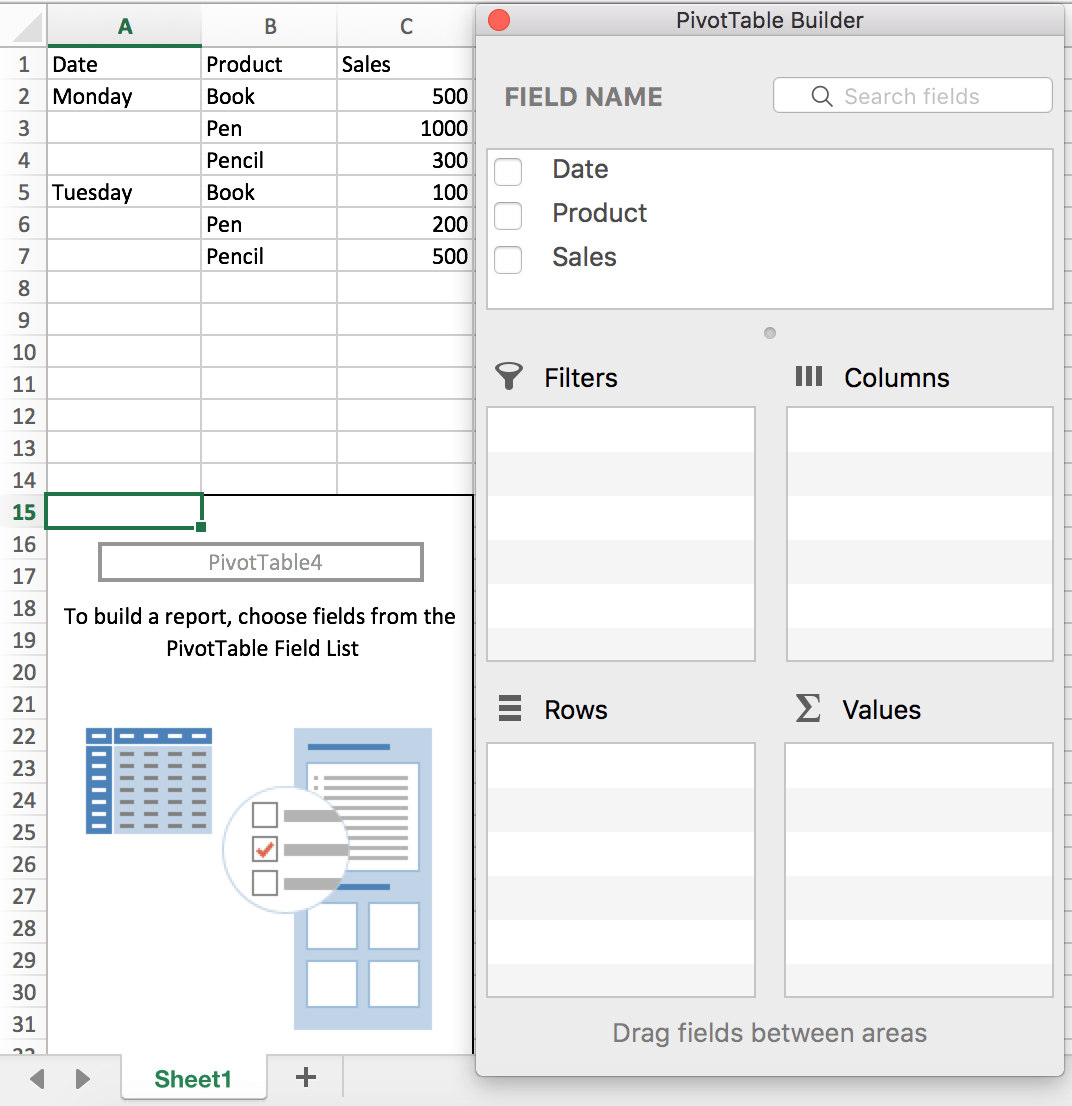
First as we usually do, prepare a list or table for Product and Sales. See below:
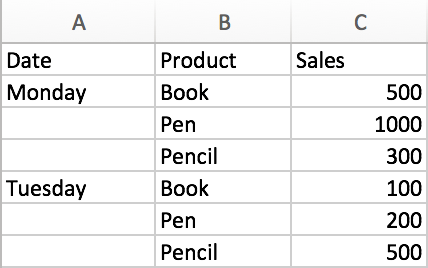
This is a quite simple table for statistic sales. We can see there are only three products. The sales are different on different dates. So how can we count the total sales for the two days? Let’s get started.
Count Data for Multiple Groups by A Pivot Table
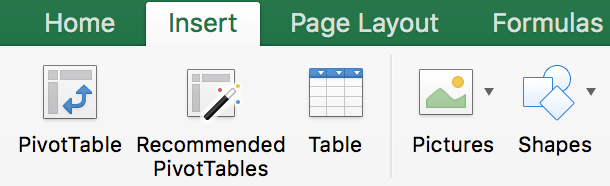
Step 1: First, we need to insert a Pivot Table.
Click on Insert tab, PivotTable is displayed in the first place of Insert functions.
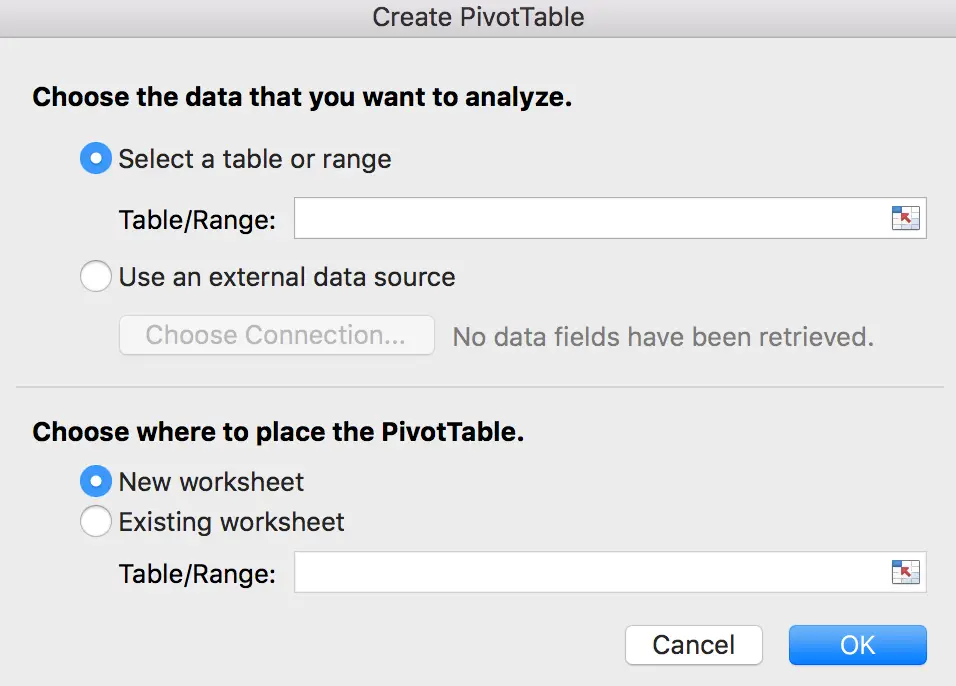
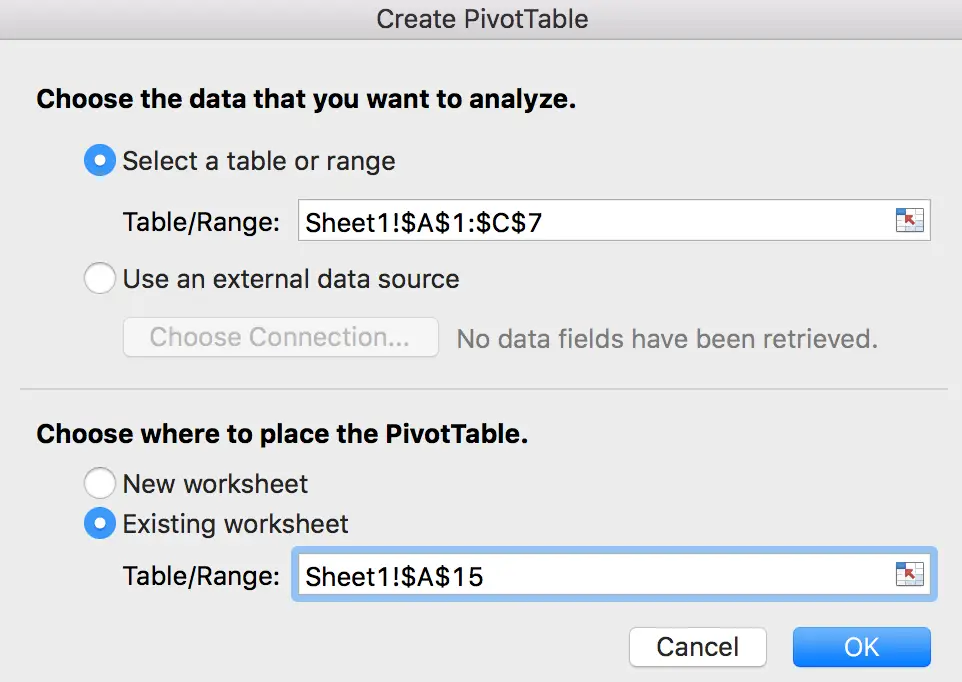
Step 2: Click on PivotTable, now Create PivotTable is loaded.
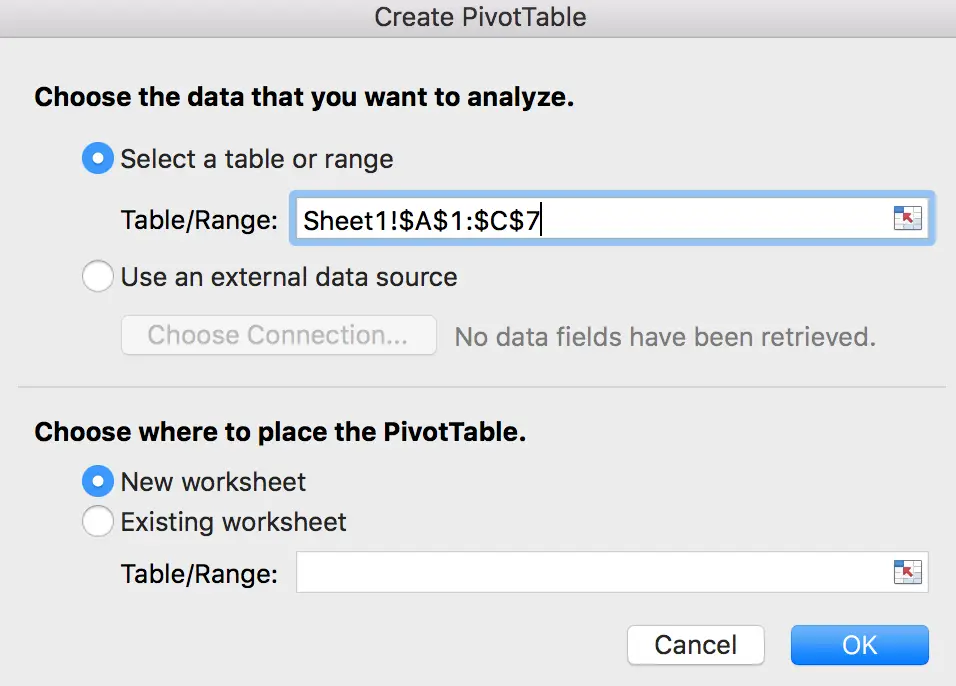
Step 3: In ‘Choose the data that you want to analyze’, check on ‘Select a table or range’, refer to the screenshot in step#1, we know the data range is from A1 to C7, so in ‘Table/Range’ field, we just select the range by mouse. After releasing the mouse, the area is automatically displayed in the textbox.
Step 4: In ‘Choose where to place the PivotTable’, check on ‘New worksheet’ or ‘Existing worksheet’ depends on your requirement. In this case, for comparing with original table, we check on ‘Existing worksheet’ to make original table and PivotTable in the same worksheet. We insert PivotTable into cell A15 for example.
Step 5: Click on OK. Now PivotTable Builder is loaded.
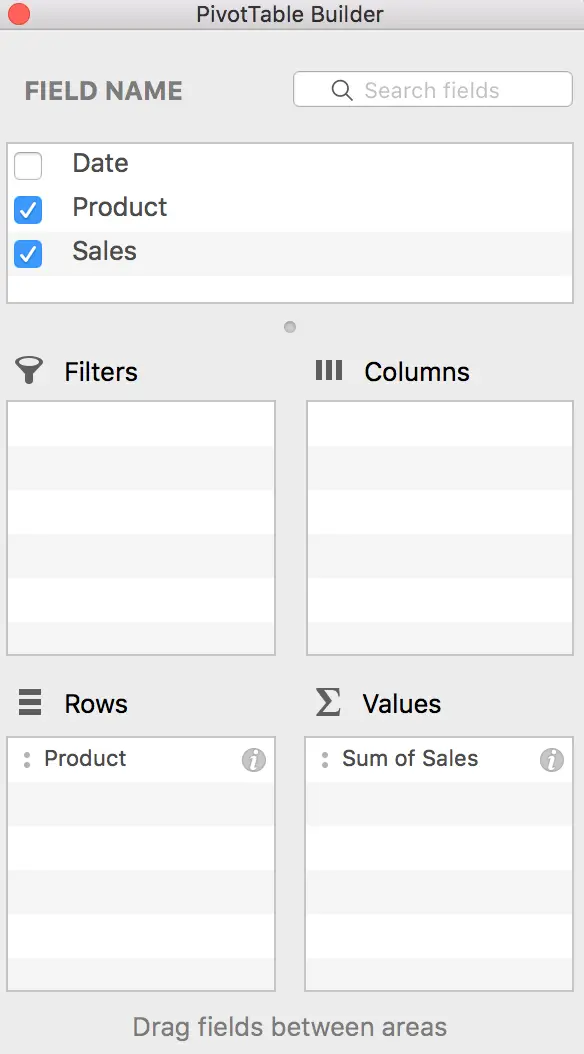
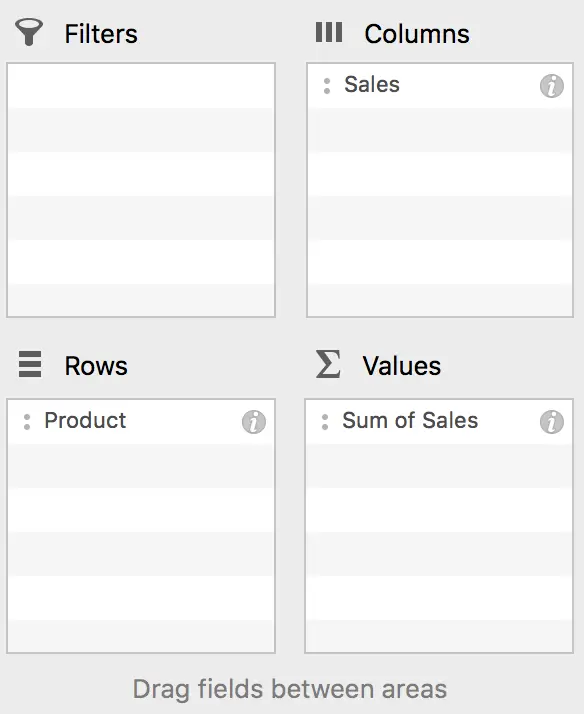
Step 6: As we want to count the sales for products, so we drag Product to Rows field, Sales to Values field.
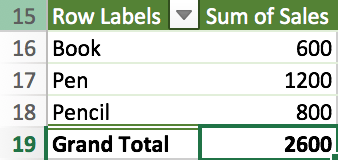
Step 7: Then a new table is displayed. We can see the total sales for each product via the new table.
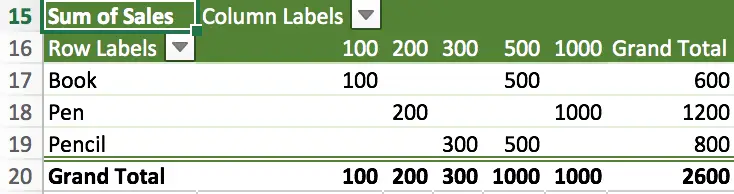
Step 8: Obviously, we can edit PivotTable Builder and update table with more conditions. For example, we can drag Sales to Column field.
Guess what table can we get? See below. We can get more details from below table.
Above all, you can adjust PivotTable per your requirement, add or remove conditions to make the table meet your needs. In our life, we can use PivotTable to count data in different groups refer to above steps.