When creating a chart for existing table, light grey border will be displayed around chart by default. If we want to remove chart border or add it back again (or change color), we can through editing Format Chart Area->Border Color to add or remove chart border properly. This article will show you the details about this function.
Precondition:
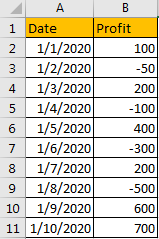
Prepare a table first.
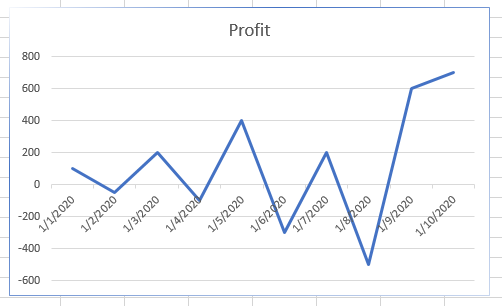
Then create a chart for this table via Insert tab->Recommended Charts (select a chart).
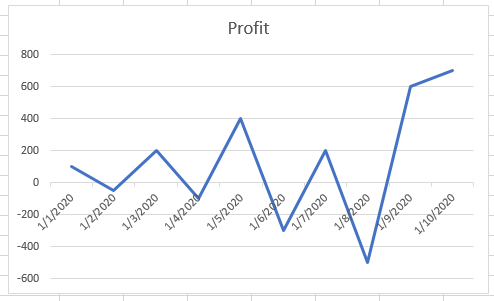
Verify that border is displayed in light grey.
Method 1: Remove Chart Border in Excel
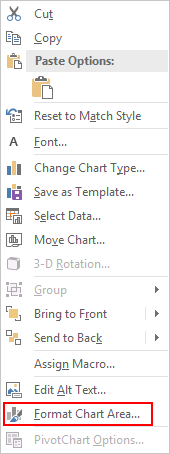
Step 1: Click on the border, right click to load menu, select ‘Format Chart Area’.
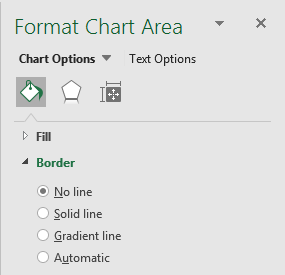
Step 2: On Format Chart Area, under Chart Options click Fill & Line icon, under Border options check on No line.
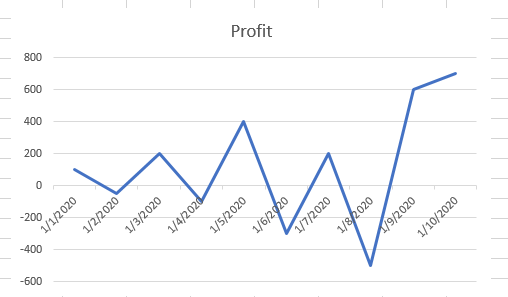
Verify that now chart border is removed.
Method 2: Add Chart Border in Excel
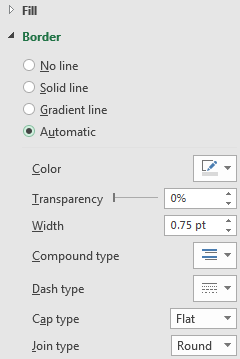
If we want to add border back, we just need to check on Solid line, Gradient line or Automatic line per our demand.
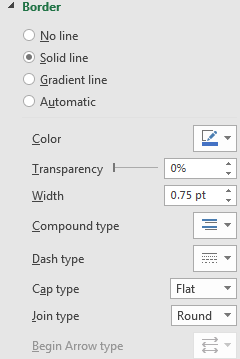
Step 1: Still in Format Chart Area, under Fill & Line->Border, check on Solid line. Select color, you can also edit or adjust other parameters like transparency or width.
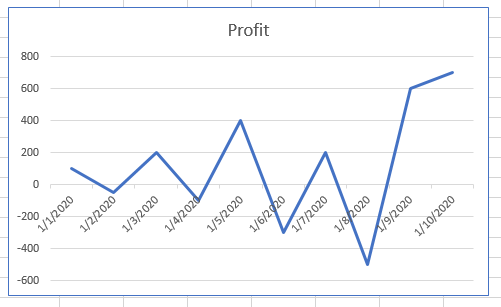
Then solid border is displayed.
Step 2: Check on Gradient line.
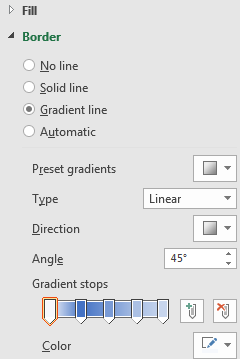
Border color is displayed in gradient.
Step 3: Check on Automatic line. You can get light grey border by default as the chart is created. You can also edit parameters to show different border by checking on Automatic line.