This post will guide you how to insert a bar chart in a cell in excel. And How do I insert a bar chart into a cell with conditional formatting function in excel. How to insert a bar chart into a cell in excel with the REPT function.
Table of Contents
1. In-Cell Bar charts with the REPT Function
You can easily create an in-cell bar chart using REPT function in excel, just do the following steps:
#1 select on cell in a new column that next to the source data, such as: Cell C2, then type the following formula in the formula box of cell C2. Press Enter key in your key board. Then drag Auto Fill Handler over other cells to apply this formula.
=REPT("g",B2/50)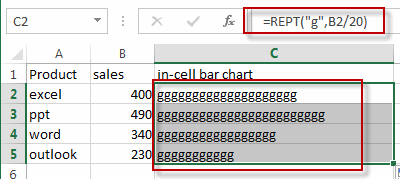
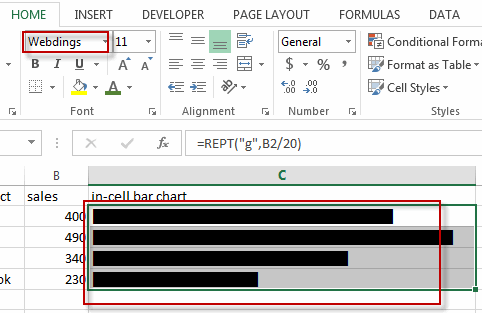
#2 select that new column, go to HOME tab, type Webdings in Fond style under Font group, and press Enter key,
#3 click Fond Color icon, and select a font color from the drop down list.
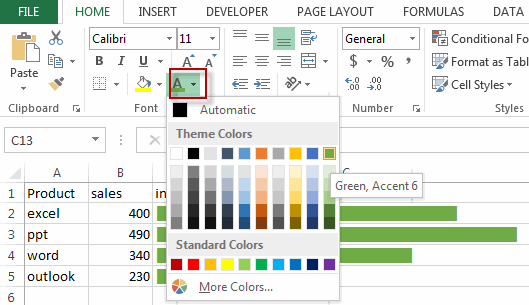
#4 you will see that the in-cell bar chart have been inserted into each cell in new column.

2. In-Cell Bar Charts with the Conditional Function
You can also use the Conditional Function to insert an in-cell bar chart, you can refer to the following steps:
#1 select the source data that you want to create in-cell bar chart, such as: range B2:B5
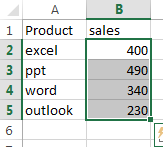
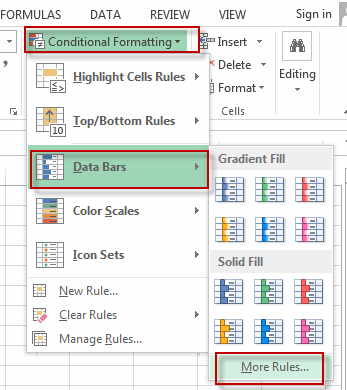
#2 go to HOME tab, click Conditional Formatting command under Styles group, and select Data Bars , then select More Rules…. The New Formatting Rule dialog will appear.
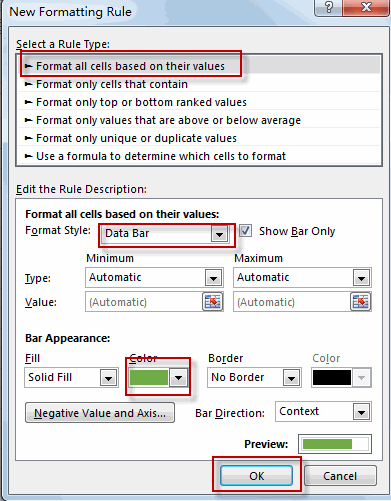
#3 select Format all cells based on their values in the Select a Rule Type list. And select Data Bar as Format Style. Check Show Bar Only check box. Set bar color as you need in the Bar Appearance section. Click OK button.
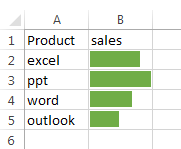
#4 let’s see the result.
3. Video: Creating in-cell bar Chart
This Excel video tutorial where we explore two methods to seamlessly integrate in-cell bar charts into your Excel spreadsheets. Our first method employs the REPT function, providing a formula-based approach for dynamic visualizations. Following that, we’ll delve into the second method, utilizing the power of Conditional Formatting to enhance the visual representation of your data.
4. Related Functions
- Excel REPT function
The Excel REPT function repeats a text string a specified number of times.The syntax of the REPT function is as below:= REPT (text, number_times)…
Leave a Reply
You must be logged in to post a comment.