This article will talk about how to calculate the coefficient of variation by formula in a Microsoft Excel spreadsheet or Google Sheets.
Table of Contents
- What is the Coefficient of Variation?
- Calculation of coefficient of variation
- General Formula
- Formula Explanation
- Q & A
- 1. What is CV instatistics Excel?
- 2. How do we calculate the coefficient of variation?
- 3. Why do we need to calculate the coefficient of variation?
- 4. What is the difference between coefficient of variation and standard deviation?
- 5. What is the coefficient of variation and do you have an example?
- 6. If the variance is 15 and the mean is 70, what is the coefficient of variation?
- Video: Calculating coefficient of variation in Excel/Google sheet
What is the Coefficient of Variation?
The coefficient of variation is the ratio of the standard deviation of the original data to the mean of the original data. The coefficient of variation has no scale, so an objective comparison can be made. In fact, the coefficient of variation can be thought of as an absolute value that reflects the degree of dispersion of the data, just like the extreme deviation, standard deviation and variance. Its data size is influenced not only by the degree of dispersion of the variable values, but also by the size of the mean of the variable values.
Calculation of coefficient of variation
The coefficient of variation is calculated as:
C.V = (standard deviation / mean ) × 100%
If the coefficient of variation is small, the degree of variation (deviation) is small and the risk is small; conversely, if the coefficient of variation is large, the degree of variation (deviation) is large and the risk is large.
Note: The magnitude of the coefficient of variation is influenced by the mean and standard deviation statistics, so it is better to list both the mean and standard deviation when using the coefficient of variation to express the degree of variation of information.
General Formula
You can use the following general formula in Excel or Google Sheets to calculate the coefficient of variation, as follows.
=STEDV.P(A1:A5)/AVERAGE(A1:A5)
where A1:A5 is the sample data to be calculated and the data needs to be in the same row.
Formula Explanation
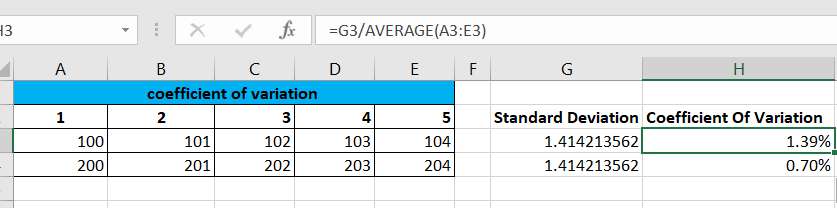
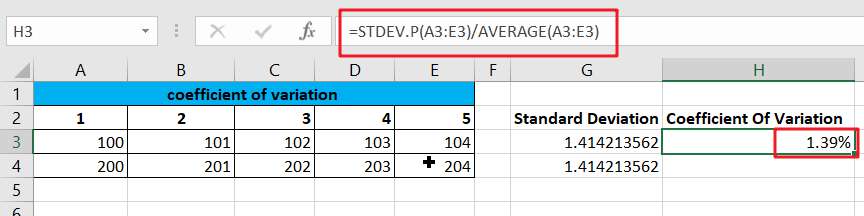
Let’s explain how the above general formula works. In order to calculate the coefficient of variation in Excel or google sheets, you need to use the STDEV.P function in a formula combined with the AVERAGE function. In the example in this article, you need to enter the following formula in cell H3.
=STDEV.P(A3:E3)/AVERAGE(A3:E3)
You need to calculate the standard deviation using the STDEV.P formula by entering the following formula in cell G3.
=STDEV.P(A3:E3)
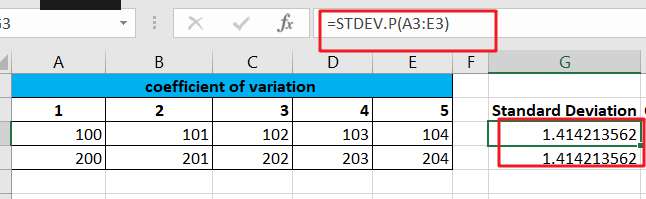
Then drag the Fill Handler to cell G4 and apply the formula above. You will see that the difference between the standard deviation values in G3 and G4 is very small. So in order to distinguish the degree of their variation, you need to calculate the coefficient of variation, which can be done by entering the following formula in cell H3.
=G3/AVERAGE(A3:E3)
This formula will first calculate the mean of the A3:E3 range and then divide the mean by the standard deviation value in G3 so that the coefficient of variation can be calculated. You will then need to drag the fill handler from cell H3 to cell H4 in order to apply the above formula.
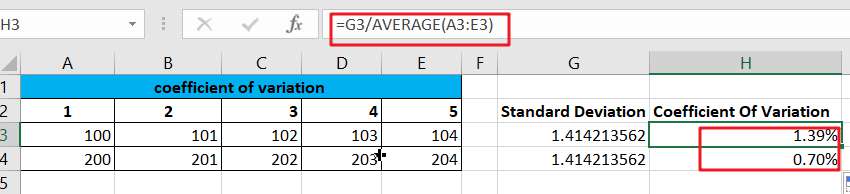
From the values in H3,H4 you can see that the difference is still significant.
Q & A
1. What is CV instatistics Excel?
The coefficient of variation, also known as the “standard deviation rate,” is another statistical indicator that measures the degree of variation in the observations in a data set. When comparing the degree of variation of two or more data, if the units of measurement are the same as the mean, the standard deviation can be used directly for comparison. If the units and/or the mean are different, the degree of variation cannot be compared using the standard deviation, but rather the ratio of the standard deviation to the mean (relative value).
The ratio of the standard deviation to the mean is called the coefficient of variation or C.V. The coefficient of variation eliminates the effect of different units and/or means on the comparison of the degree of variation of two or more data.
2. How do we calculate the coefficient of variation?
The formula for calculating the coefficient of variation is: Coefficient of variation = (standard deviation/mean) × 100%.
3. Why do we need to calculate the coefficient of variation?
When you need to compare two sets of data, if the measurement scales of the two sets of data are too different, or there are differences in the scales of the data, it is not appropriate to compare them directly with the standard deviation, then you have to eliminate the influence of the measurement scale, and the coefficient of variation can do this, it is the ratio of the standard deviation of the original data to the mean of the original data.
4. What is the difference between coefficient of variation and standard deviation?
Both standard deviation and coefficient of variation are common statistical indicators used to describe the dispersion of data.
Standard deviation: It is an absolute indicator of the dispersion of each observation centered on the arithmetic mean. The standard deviation cannot be used to compare the dispersion of two sets of data when the overall mean is different or when the units of measurement are different.
Coefficient of variation: The ratio of the standard deviation to the mean is called the coefficient of variation, denoted as C.V. The coefficient of variation eliminates the effect of different units and/or means on the comparison of the degree of variation of two or more data.
5. What is the coefficient of variation and do you have an example?
Which of the two breeds of adult sows has a greater degree of variation in weight, when the average weight of adult sows in a breeding farm is 200 kg with a standard deviation of 10 kg, while the average weight of adult sows in category B is 206 kg with a standard deviation of 8 kg.
Although the observed values in this case are all the same weight per unit, their means are not the same and the coefficient of variation can only be used to compare their degrees of variation.
Coefficient of variation for the weight of adult sows of breed A: CV = 10/200 x 100% = 5%
Coefficient of variation for the weight of adult sows of breed B: CV = 8/206 x 100% = 3.88%.
Therefore, the degree of variation in body weight of adult sows of breed A is greater than that of adult sows of breed B.
6. If the variance is 15 and the mean is 70, what is the coefficient of variation?
The coefficient of variation is: 21%. (15/70=0.21)